Interseis SIA
Shallow geophysical investigations
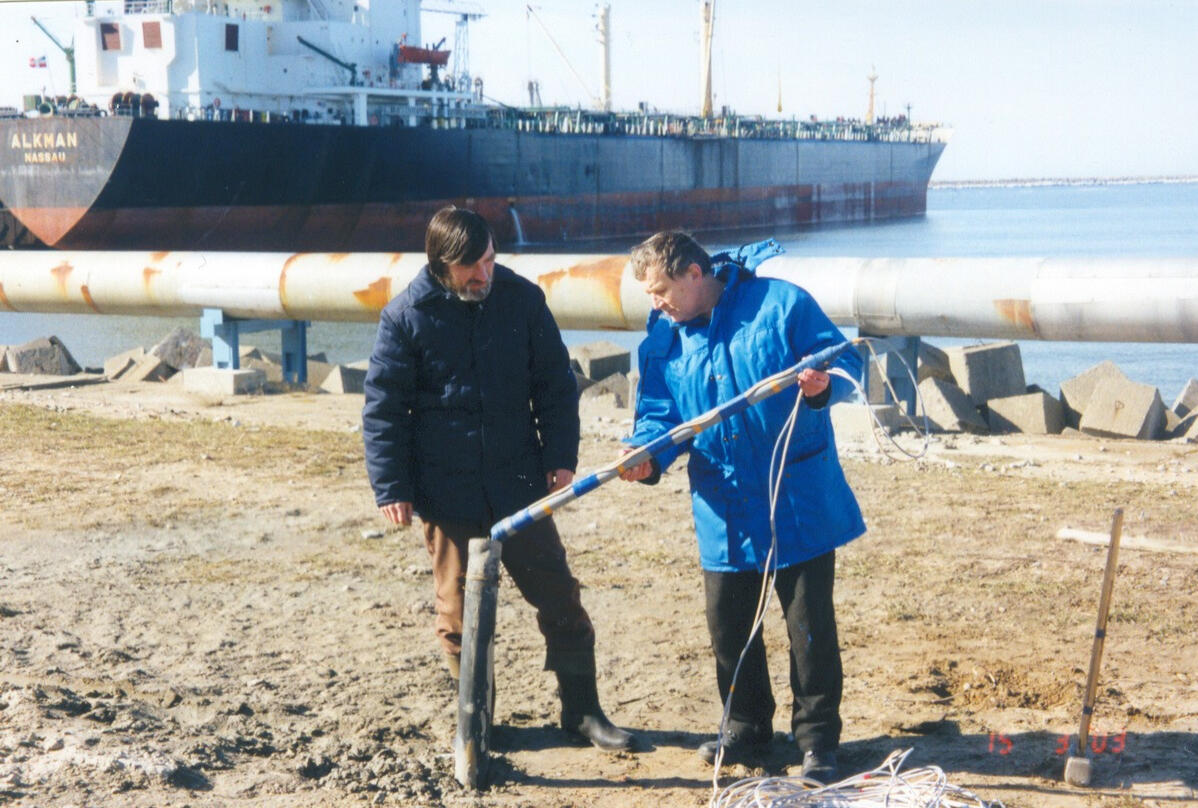
Shallow geophysical techniques
Ground penetration radar (GPR)
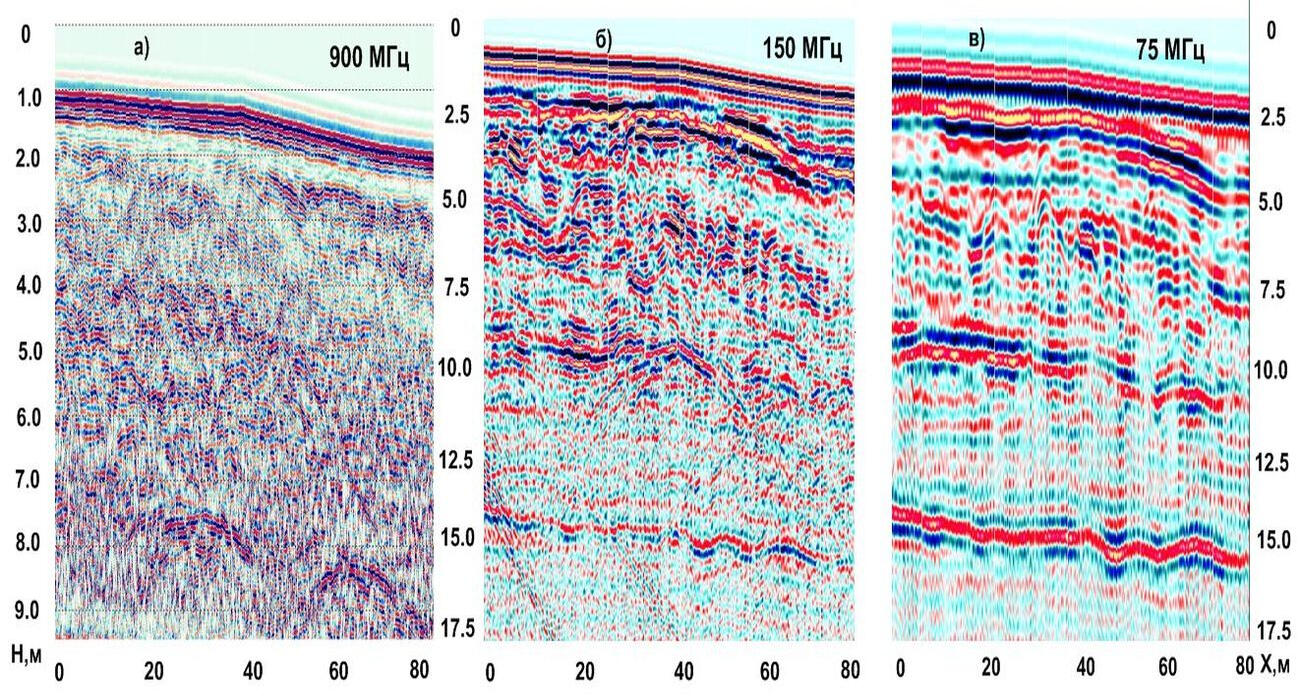
Multi-frequency GPR sounding
GPR profiles on the territory of the sand quarry
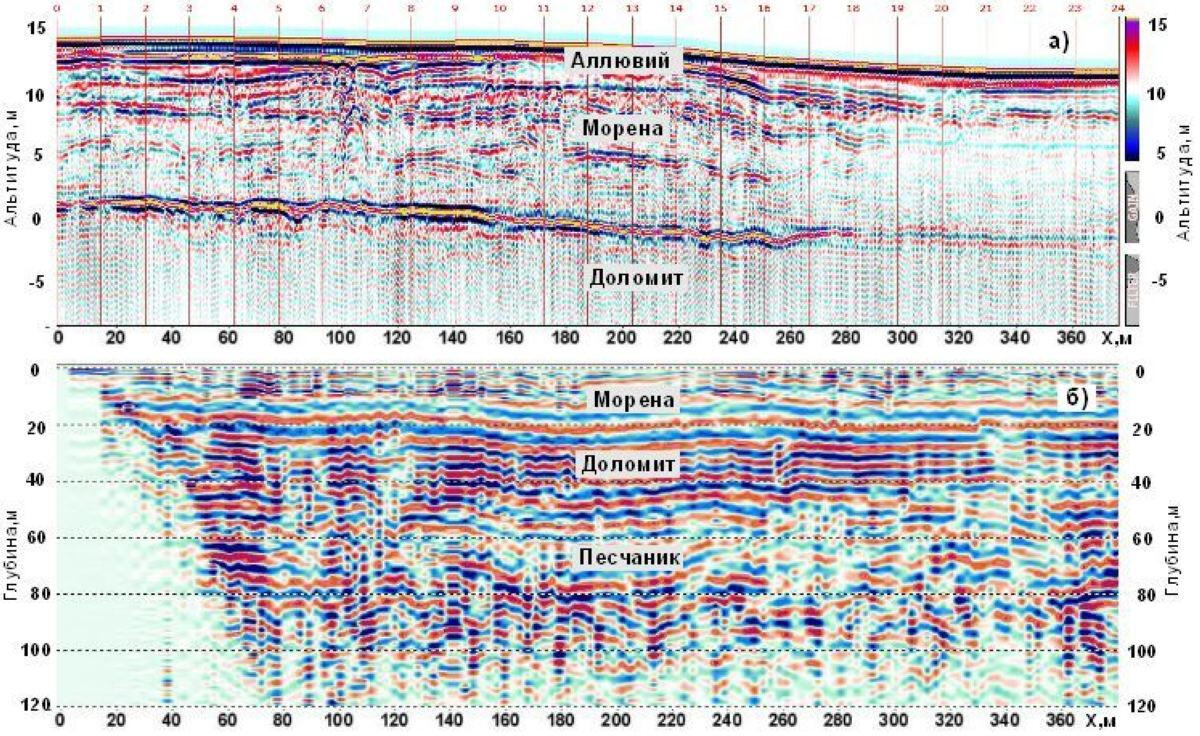
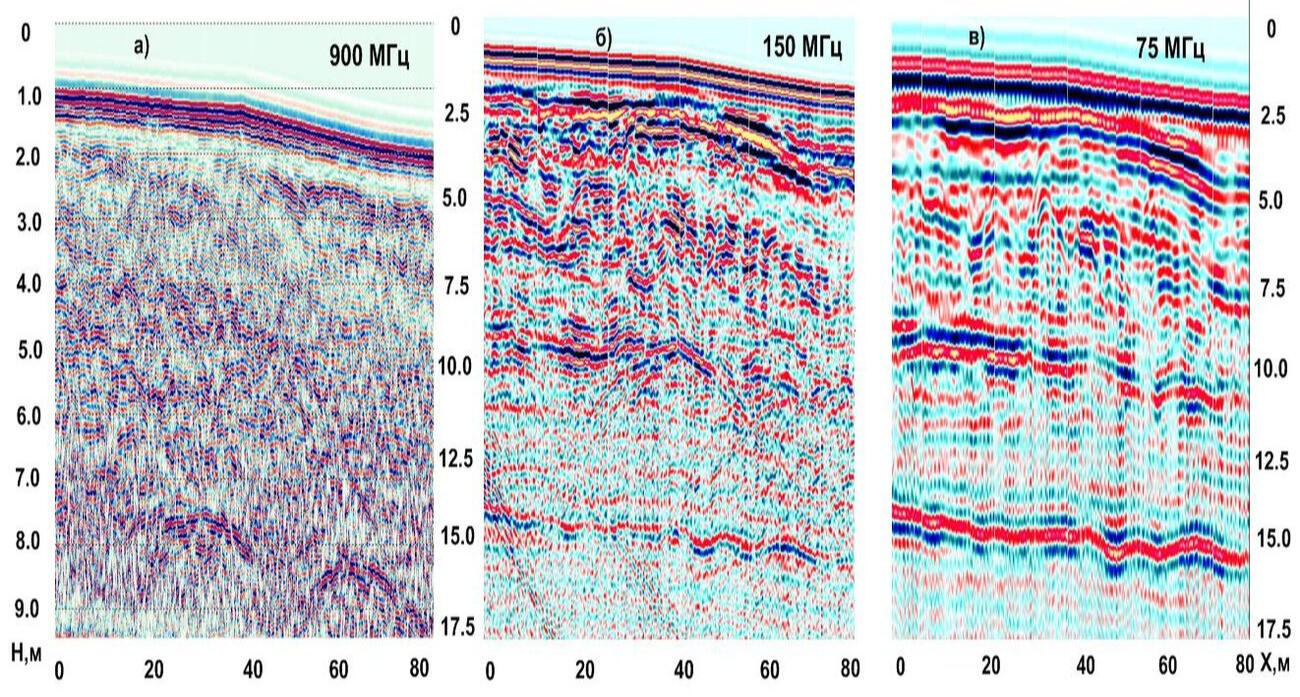
Application of the georadiolocation (GPR) method is very effective in condition of moraine and alluvial sediments and during of upper part of the loose sandy soil massif structure and the surface of bedrocks studying . At deep occurrence of groundwater level the use of dipole low-frequency antennas allows to reach the depth of 15-20 m, to trace the boundaries of the soil massif layers and the surface features of the bedrocks.The figure shows examples of georadar sections (75-150-900 MHz) that detail the structure of moraine soils above the surface of the bedrocks, and are an effective addition to the seismic method of reflected waves. The possibility of using in the complex of high frequency shielded antenna 900 MHz for these purposes is severely limited, since the penetration depth of the pulse is usually not more than 3-4 m, even in dry sandy soils.
GPR sounding of the ground foundation of passenger quay embankment
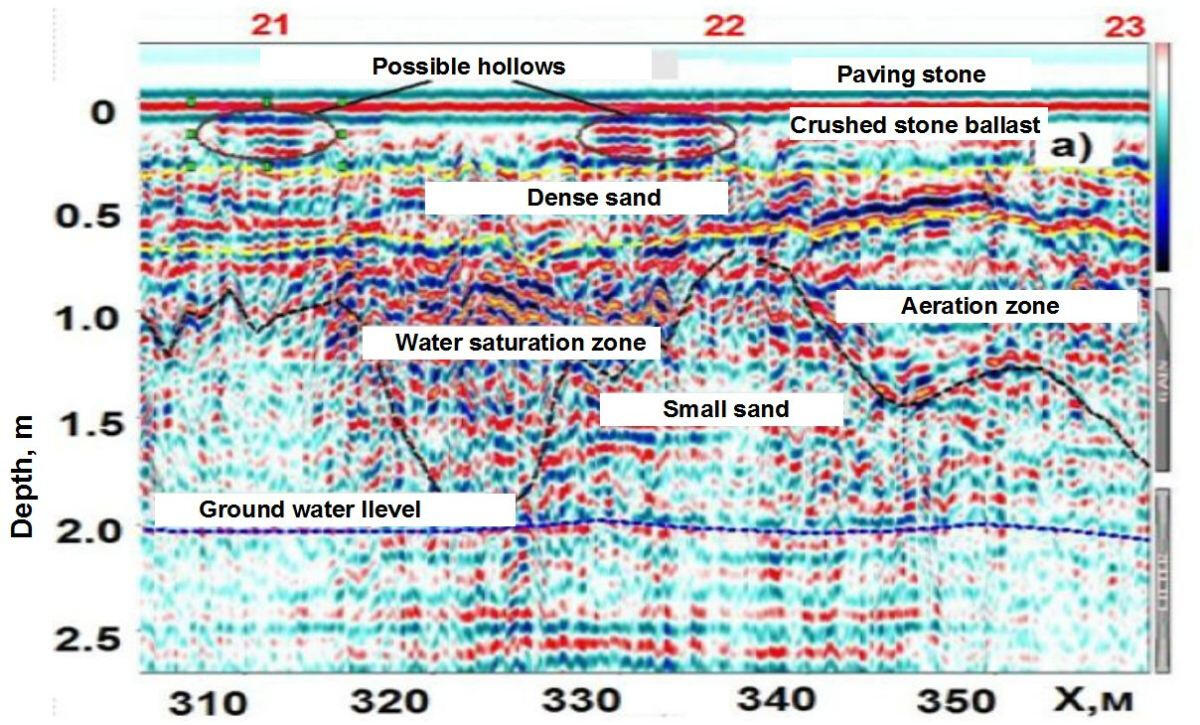
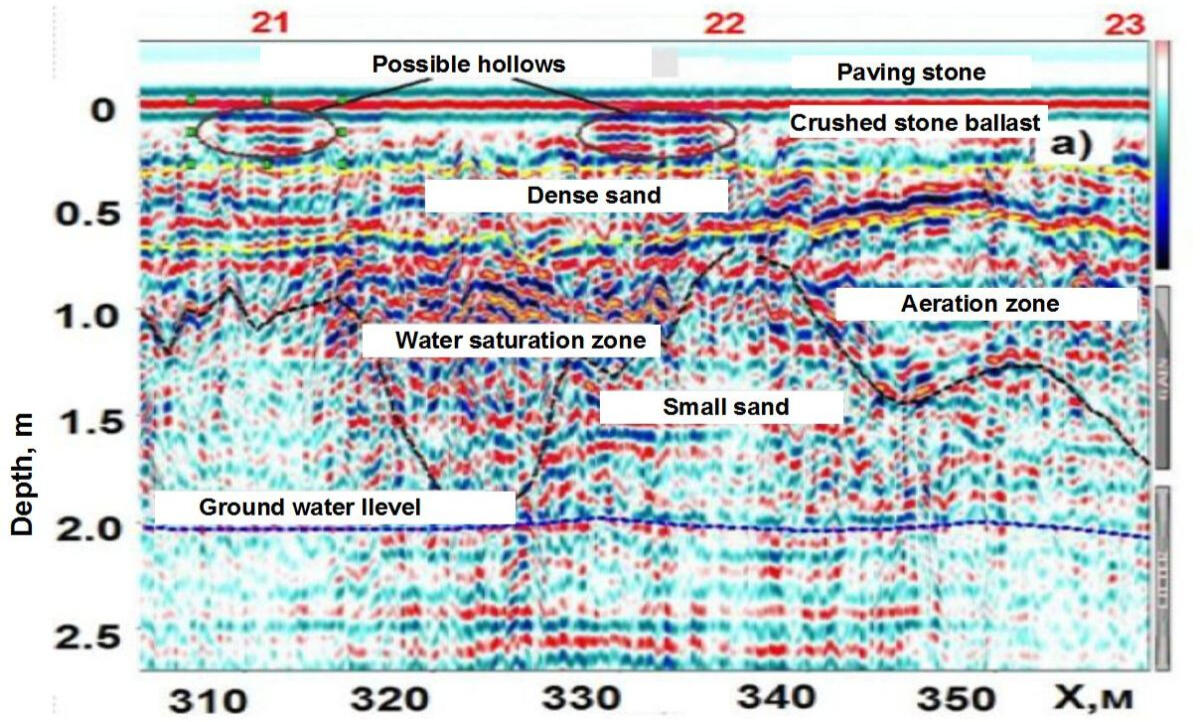
The use of shielded high-frequency antenna is more effective within urban areas during detection of soil decompaction zones under hard surfaces of roads and pavements. An example of interpretation of bulk soil array sounding data is shown below. Under the cobblestone coating and crushed stone backfilling, there are areas of increased amplitudes of reflections and prolonged time of their registration associated with possible zones of decompaction and increased water saturation in sandy soil.Example of GPR profile obtained using a shielded high frequency (900 MHz) antenna at the berth area with cobblestone pavement.The strongest reflecting boundaries are most likely associated with the surfaces of water-saturated lenses in a sandy massif. Due to accumulation of rainwater on the paving stones, it was possible their penetrate into the near-surface layer of crushed stone and soil, which significantly changes and complicates wave pattern on the records due to a sharp change in the dielectric permeability of the soil. Low-frequency radar sensing is a very effective method for mapping the surface of ground waters in sandy sediments. At the same time, the surface of water-saturated soils is a strong shielding boundary, below which the tracing of reflecting boundaries in the sandy-clay thickness is problematic.
Detection of man-made objects in the soil massif
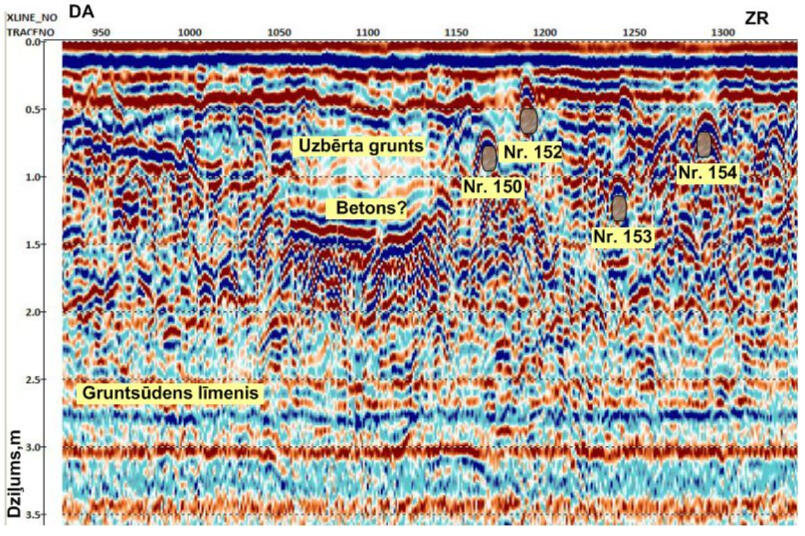
Under the main reflection phase there are areas of increased amplitude of the signal reflected (scattered) on many small objects. Such objects on the GPR profile are most likely interpreted as fragments of concrete or asphalt pavement. Many hyperbolic phase axes of diffraction waves are recorded on a profile fragment at a depth of 0.2 m to 1.0 m. Pronounced diffractions indicate the presence of dense foreign bodies in the soil, possibly fragments of concrete structures of an old building.The profile shows characteristic diffraction waves from smaller objects, such as pipes, communication channels, wells, etc. The figure shows examples of the manifestation of such objects in the form of hyperbolic wave packets.The strongest reflective boundaries are probably associated with the surfaces of water-saturated lenses in the sand mass. Low-frequency radar sounding is a very effective method for mapping groundwater surfaces in sandy sediments. At the same time, the surface of water-saturated soils represents a rigid screening boundary, below which it is problematic to trace reflective boundaries in the sandy-clayey massif.
Mapping of the relief of reflecting horizons of the soil massif
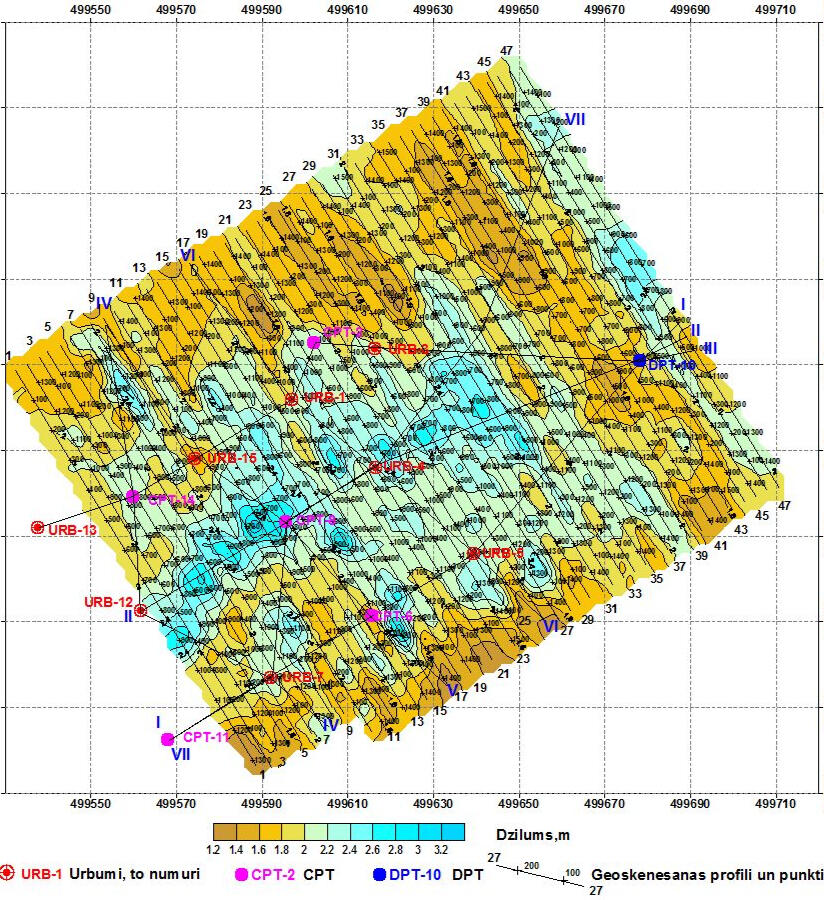
In the study area, on most GPR sections, the surface of a complex reflecting horizons located at a depth of 0.5 to 3.4 m are quite clearly visible. In the area on this reflective surface, several depressions with a depth of 1.0 to 3.4 m from the surface can be traced. The deepest of them looks like a narrow ravine 12-20 m wide and stretches from the southwestern edge of the research area to its center in a northeastern direction. At of the center of the study area there is a wider but less deep (up to 2.8 m) continuation.The picture shows a structural map of the surface of the depression bottoms. The depth of these depressions sometimes reaches 3.4 m. A wide depression of this reflecting boundary can be observed in the form of a depression elongated to the northwest with a complex boundary configuration in plan view near the northeastern border of the site. Judging by the large number of local heterogeneities in the layer above this boundary, it is dividing a layer of technogenic and soft fluvio-glacigenic sands from the surface of the dense sand and clayey deposits.
Reflected wave technique - Mini CDP
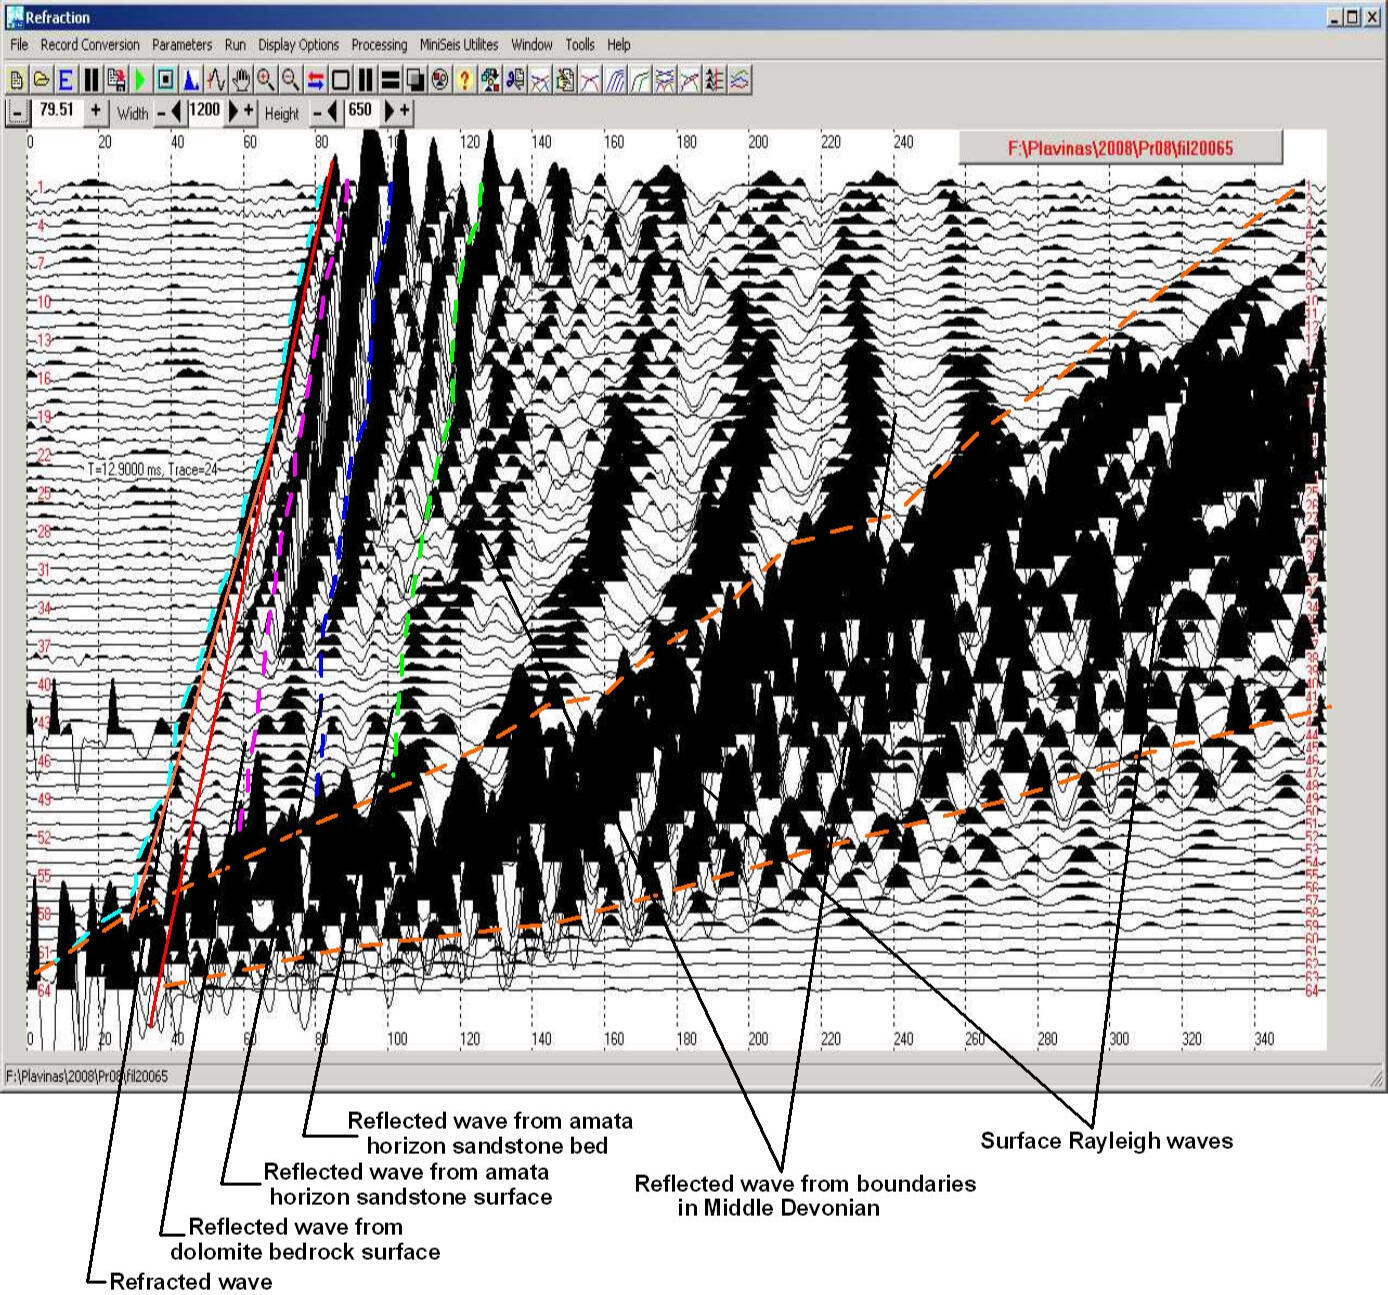
An example of recording reflected waves to a depth of about 400 m
Of all the methods used in shallow-depth seismics, the method of reflected waves in the modification of the common depth point (CDP) is provided the greatest depth of the upper part of geological section investigation. The acquiring system provides a sufficiently high density of the points of elastic waves excitation and signal reception on a profile unit in order to provide multiple overlapping tracking of the reflecting boundaries.The technology of work is quite labor-intensive, but provides the most reliable information about the geometry of physical properties boundaries in the studied space, associated not only with stratification, but also with possible violations of rock continuity due to tectonic faults and fractures . In many cases, the use of simple and environmentally safe surface sources of elastic waves such as “drop weight” allows to obtain sufficiently strong reflections from the boundaries at a depth of up to 400-500 m.
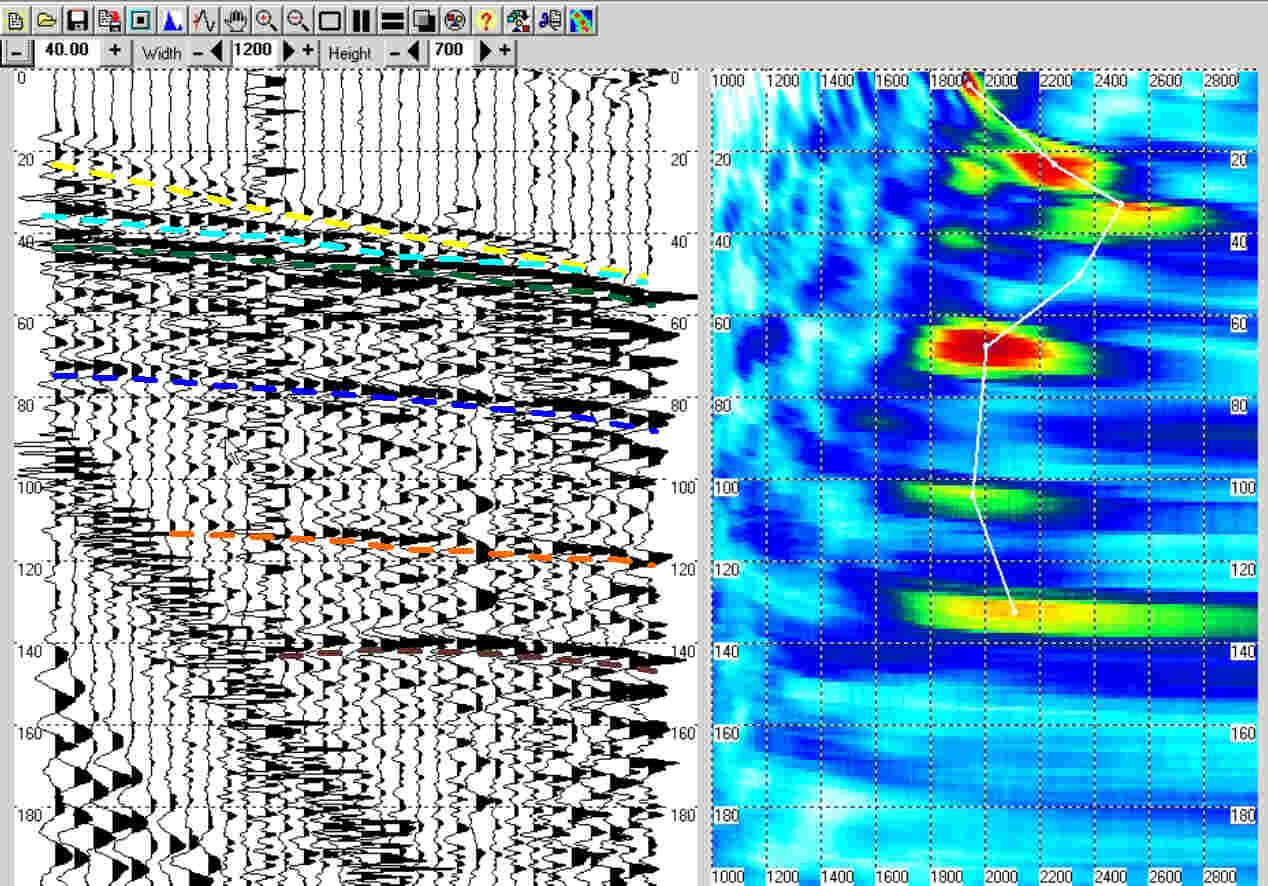
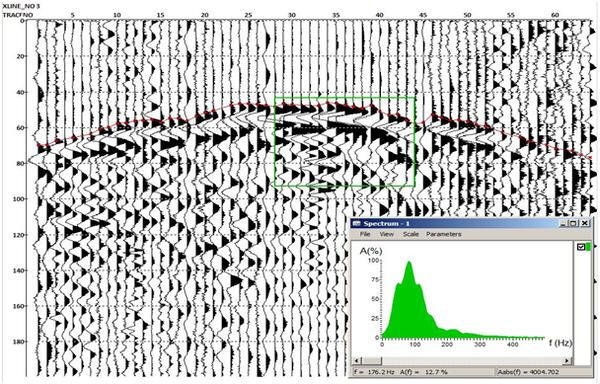
Seismogram of reflected waves and vertical velocity spectrum
Usually aim for engineering surveys is to study the properties of the soil massif and the bedrock at a depth of 40-50 m. But sometimes there are specific tasks that require depth of study of 150-200 m. An example of such problems in the North-West of the Russian platform is the mapping and study of the structure of the buried pre-glacial valleys filled with moraine deposits. Similar problems arise in the study of erosion cuts in Paleozoic halogen-carbonate strata filled with low-velocity Mesozoic or Quaternary deposits. In some cases it is possible to obtain section with depth up to 200 m when sledge hammer weighing 6-8 kg is used as a source of elastic waves. Below an example of a time section across the palaeovalley edge buried in the area downstream of Plavinas hydroelectric power station is shown on the site survey for the projected renovation of drainage wells.
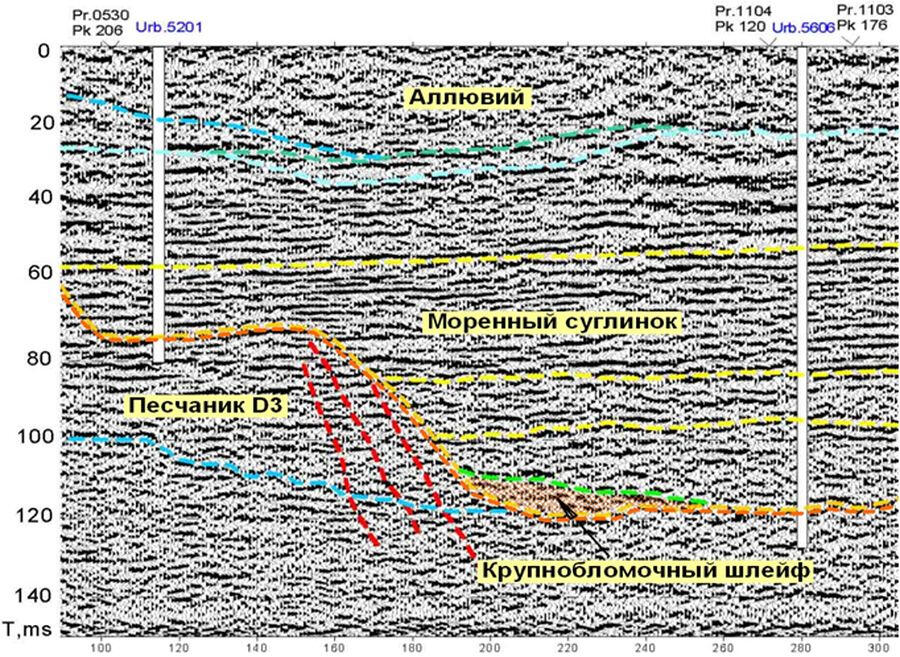
Fragment of CDP time section on a profile across the buried palaeovalley edge. Area of the drainage wells location in the lower pool of Plavinas HPP
The upper part of the section is alluvial deposits. In the initial part of the profile, on the valley edge – Salaspils carbonates . Thickness of the dolomites is small, practically whole incision locates into the Upper Devonian Amata sandstone sediments. The sides of the lower part of the incision are composed of weak sandstones of the Amata sediments. The velocity of longitudinal waves propagation in them differs little from the moraine loam filling the valley, so the sides of the incision can be distinguished only conditionally, by changing the nature of the stratification.
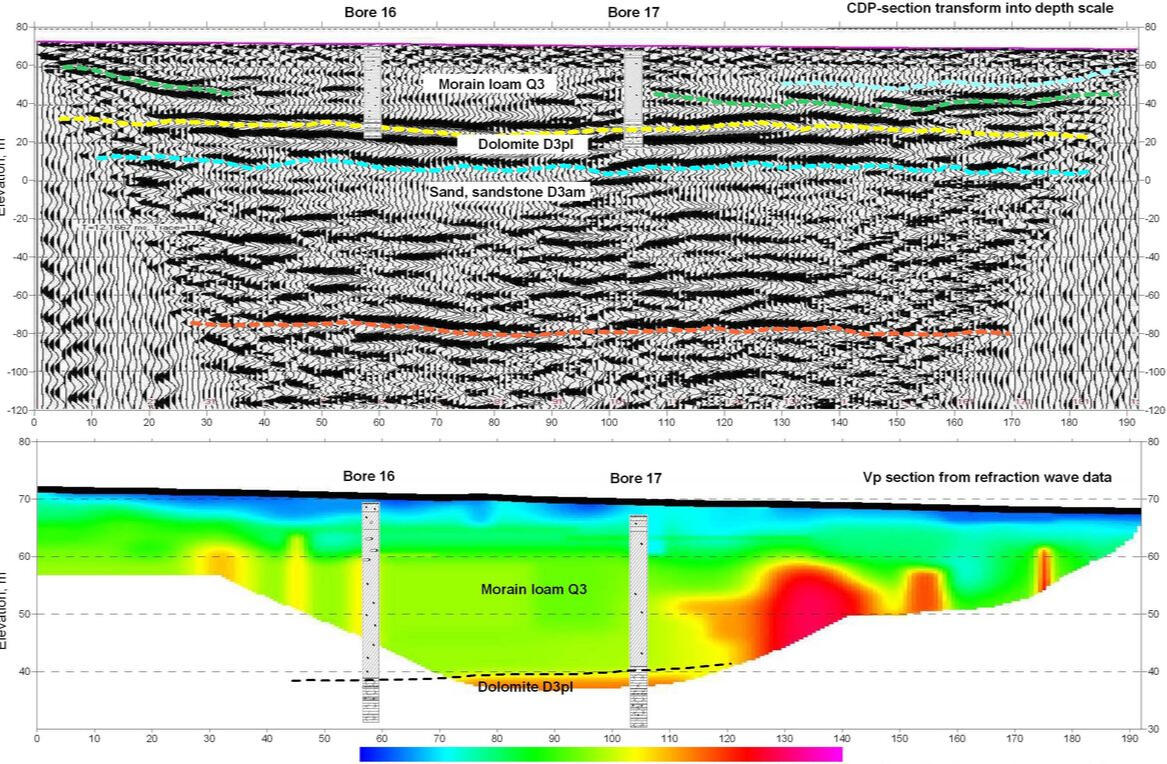
Mini-CDP section, inverted into depth scale, along the profile through the secondary sleeve-duct of buried palaeovalley. The area of Plavinas HPP upstream
This profile clearly traces the roof of bedrock dolomites at a depth of 20-23 m under a thick layer of moraine loams. In the side parts of the valley reflecting boundary can be traced, associated, presumably, with the coarse deluvial sediments in the cut off parts of the strips. In this example, differences in depth of investigation of different methods clearly manifest. Thus, a boundary at a depth of about 150 m, presumably associated with the bed of loose Amata-Gauja sandstones, is traced on the CDP section, while the depth on the velocity section obtained by method of refracted waves is about 30 m with the length of the receiving geophone arrangement base of 126 m.These two sections are obtained using a sledge hammer weighing 6 kg with the accumulation of three blows. Receivers step 2 m, points of excitation in the first case-4 m, in the second-2 m. the length of the flank arrangement 126 m.
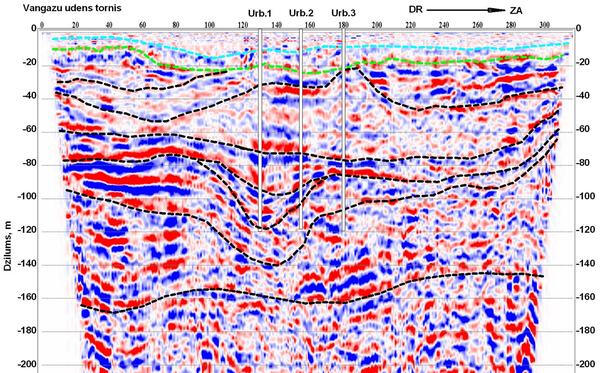
Mini-CDP section, inverted into depth scale, along the profile via buried pre-glacial palaeovalley. Area of water intake wells location near Vangazi settlement, Latvia
The section shows the complex structure of moraine deposits, filling the buried glacial valley, the formation of which occurred when glacier plowing, evidently during for several glaciers.Excitation of elastic waves by sledge hammer blows with accumulation of 3 impacts with the step of excitation points 4 m along the profile. Reflecting boundaries are traced to a depth of 200-220 m, which is displayed by the presence of energy sprouts on vertical velocity spectra.The use of a compact source – hammer is most appropriate in hard-to-reach areas. The weight of the hammer, depending on the planned detail of the study of the cut, may vary at different sites in a wide range – from 1 to 10 kg. However, due to the relatively high frequency of excited oscillations, they quickly fade in the upper loose layers of the soil, so the depth of energy penetration into the array and, especially, its distribution along the profile line on the surface are limited.
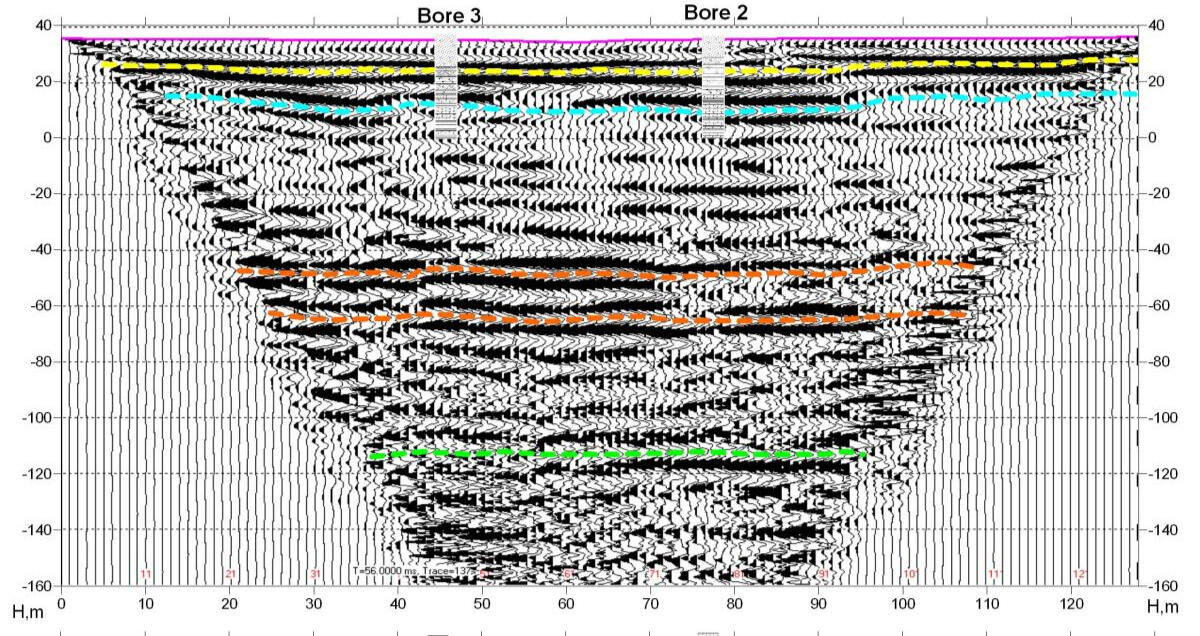
CDP cross-section in depth scale on the area with shallow dolomite bedrock. Lower pool of Plavinas HPP dam, Latvia
In the most favorable cases of high-velocity carbonate section and low thickness of loose Quaternary deposits, the depth of study of the section by reflected waves using a sledge hammer with the accumulation of several impacts can be 150-200 m. The reduction of the tracking area of deep reflecting horizons in the initial and final parts of the profile at this section is due to the need to cut (muting) the zone of intense surface waves - interference registration on the initial seismograms using the observation system without sufficient removal of excitation point from the beginning of receiving base.
Refracted wave technique
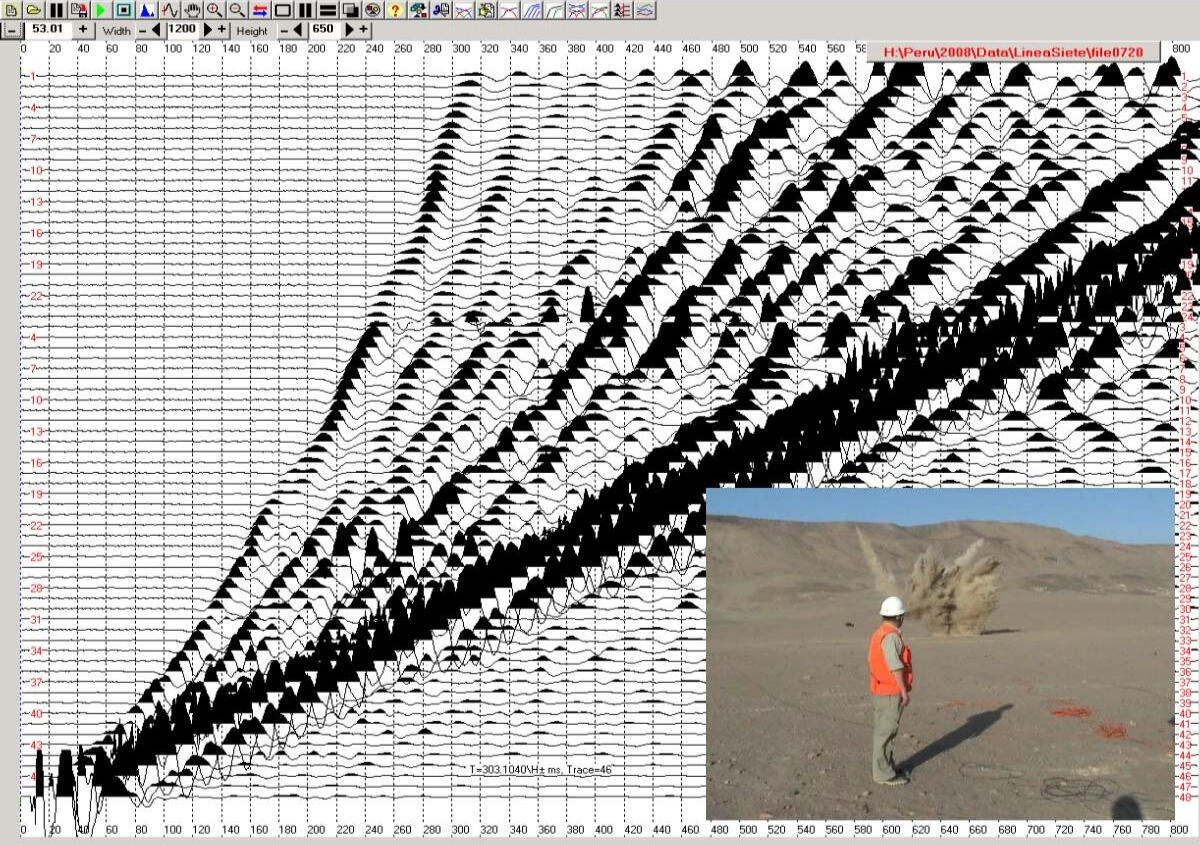
Refracted wave method of is most often used in engineering geophysics to study the geometry and physical properties of the surface of the rocks and determine the thickness of loose Quaternary deposits.
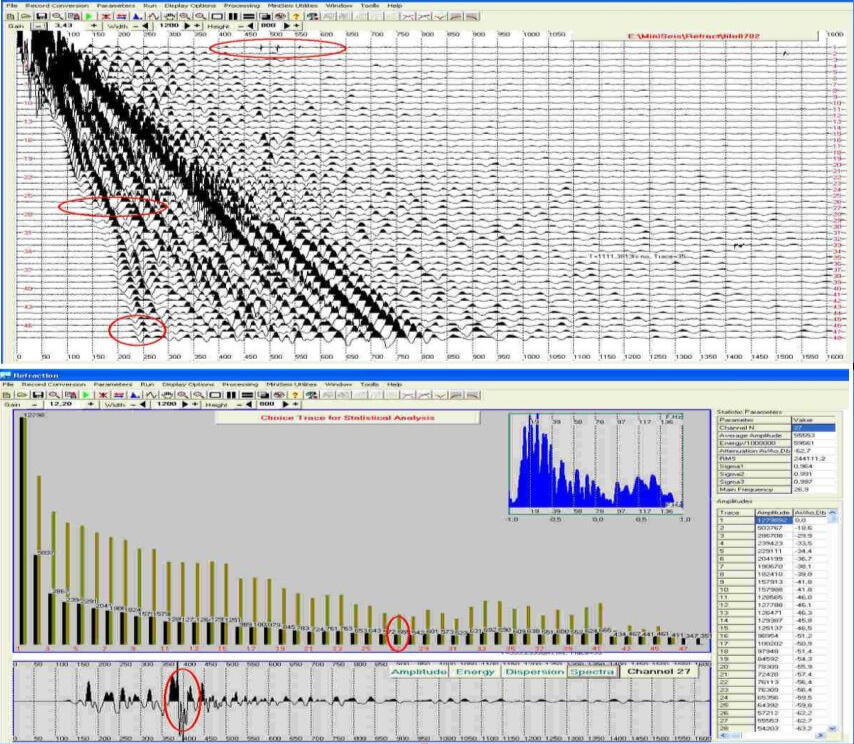
Seismogram of refracted waves from the explosion of 3 kg ammonite charge at the base of receiving 360 m (site Choclon-2, Peru)
Refraction wave technique is mostly justified when clearly denominated layering of the near-surface sediments absent and, as an effect, when there are not reflection waves on the seismic records. Investigation depth during refraction wave technique using generally consist of 25-30 % of a maximal shot-receiver distance. By thick near-surface layer of the weak soils (dry sands, peat) with elastic wave energy great attenuation for refraction wave time-distance curve obtaining in the first breaks on the receiving base 250-400 m it is necessary to use enough powerful elastic wave sources, often the explosions, where it is permitted by the environment institutions.
Analysis of amplitudes and frequency composition of oscillations on the seismogram of refracted waves
.
.
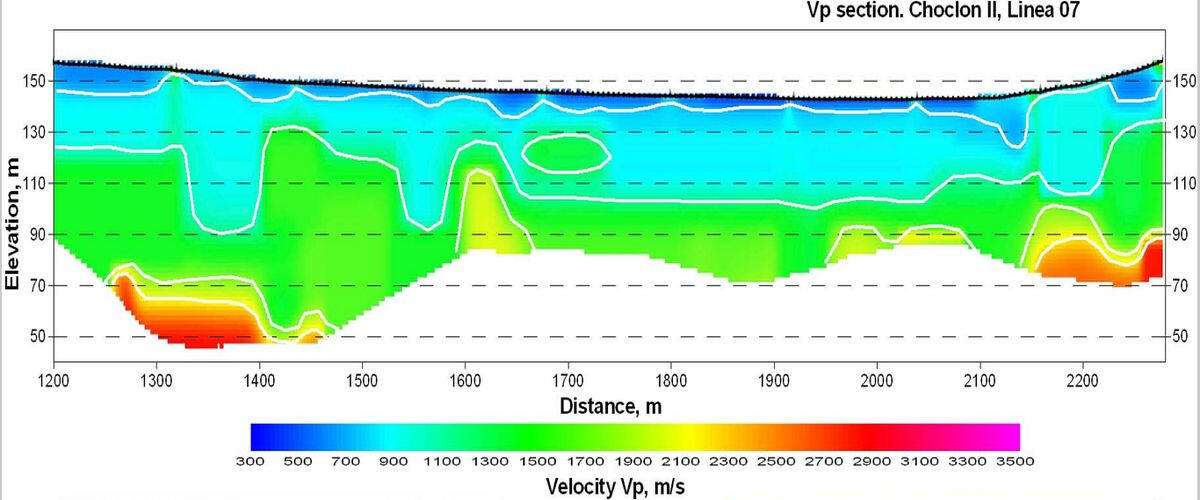
The section of Vp longitudinal waves propagation velocities
An example of refraction wave record processing for Vp velocity obtaining with SeisOptim software using at the one of Choclon II areas. Investigations of the bottom interior of the future flotation waste repository of metallurgical integrated plant (Peru).
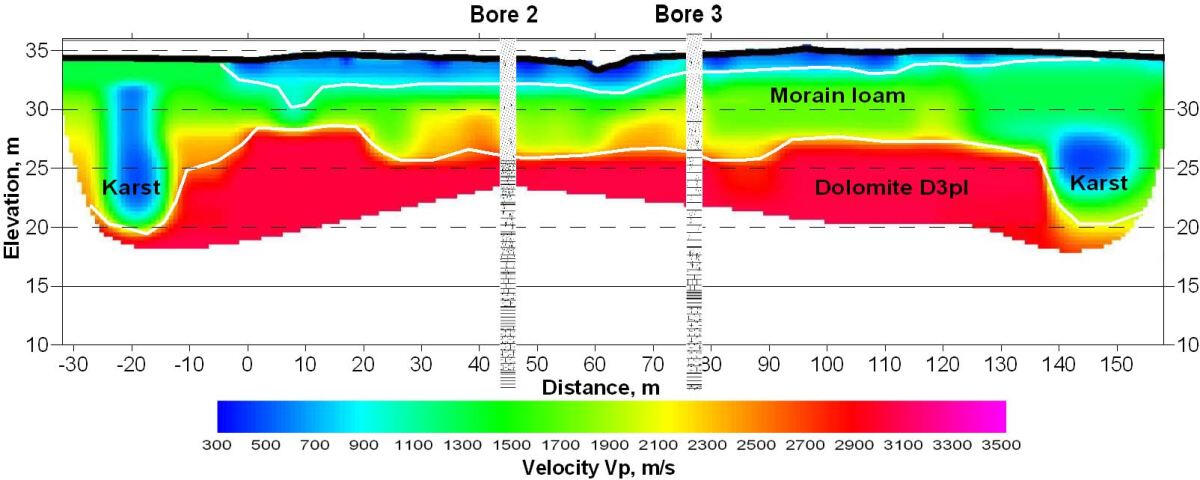
An example of the dolomite karsted surface mapping at the site of Plavinas HPP projected emergency spillway
One of the most applications of refraction wave technique is karsted areas outline in the near-surface layers of the bedrocks, represented by the halogen-carbonate sediments. In these cases the depth of investigation usually is limited by the depth of the high-velocity bedrock top, but physical properties variations of the bedrock weathered surface and overlaying near-surface soil layer are manifested enough distinctly.
Seismic surface wave method
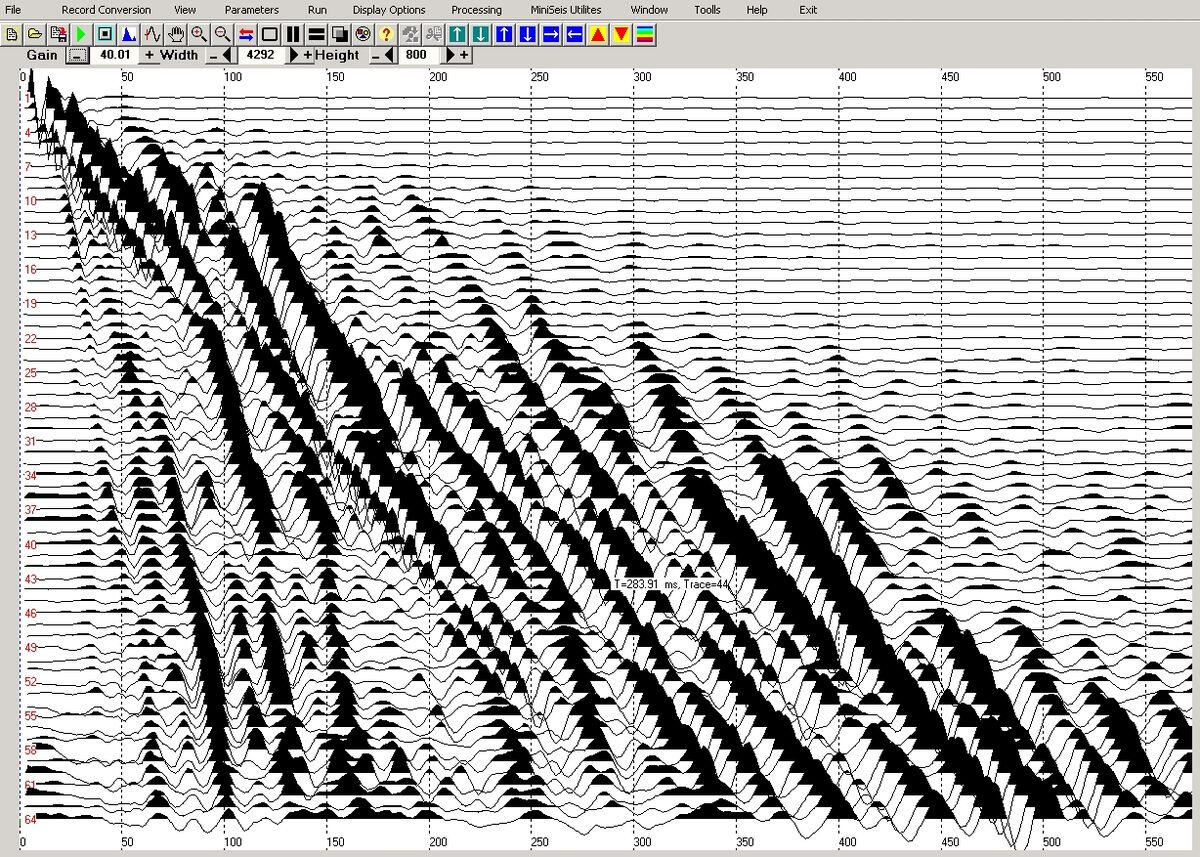
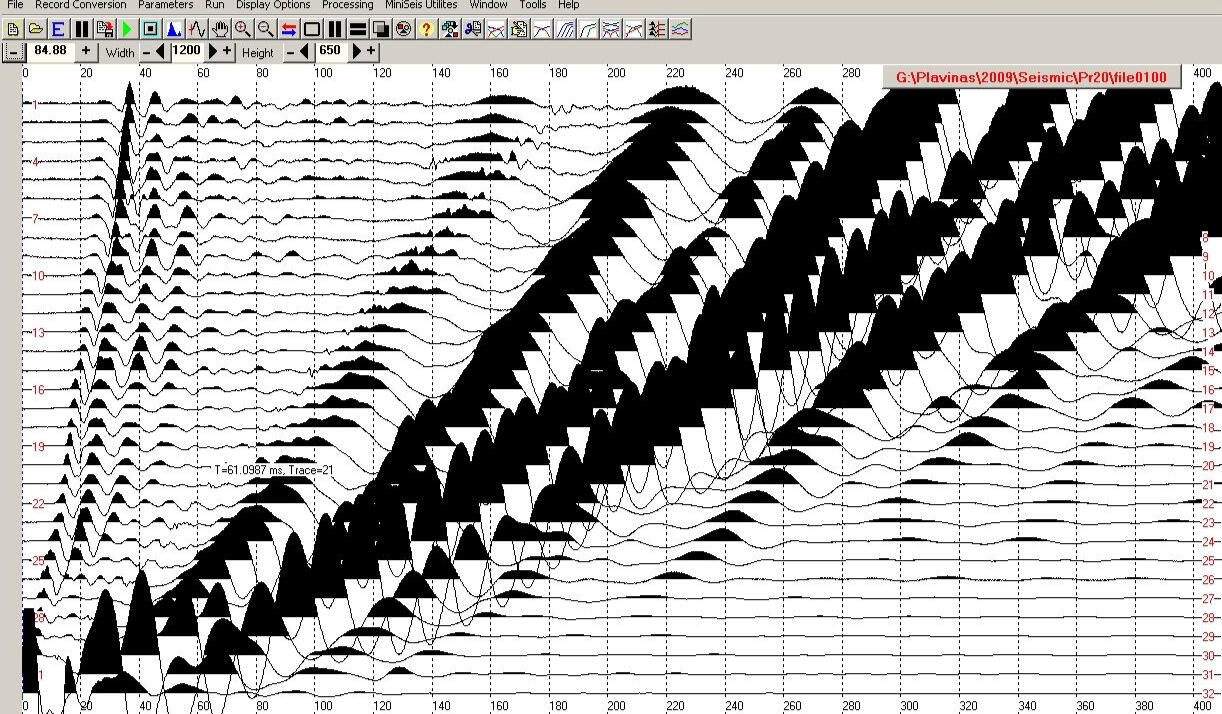
The seismogram with the records of surface waves
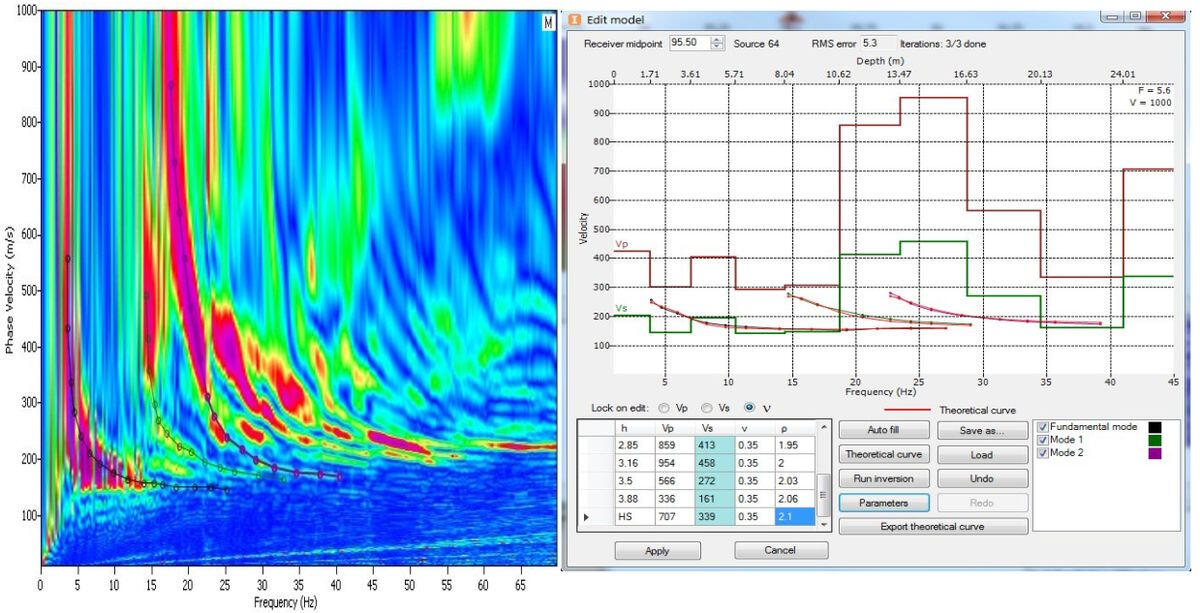
Definition of transverse waves propagation velocity by MASW method
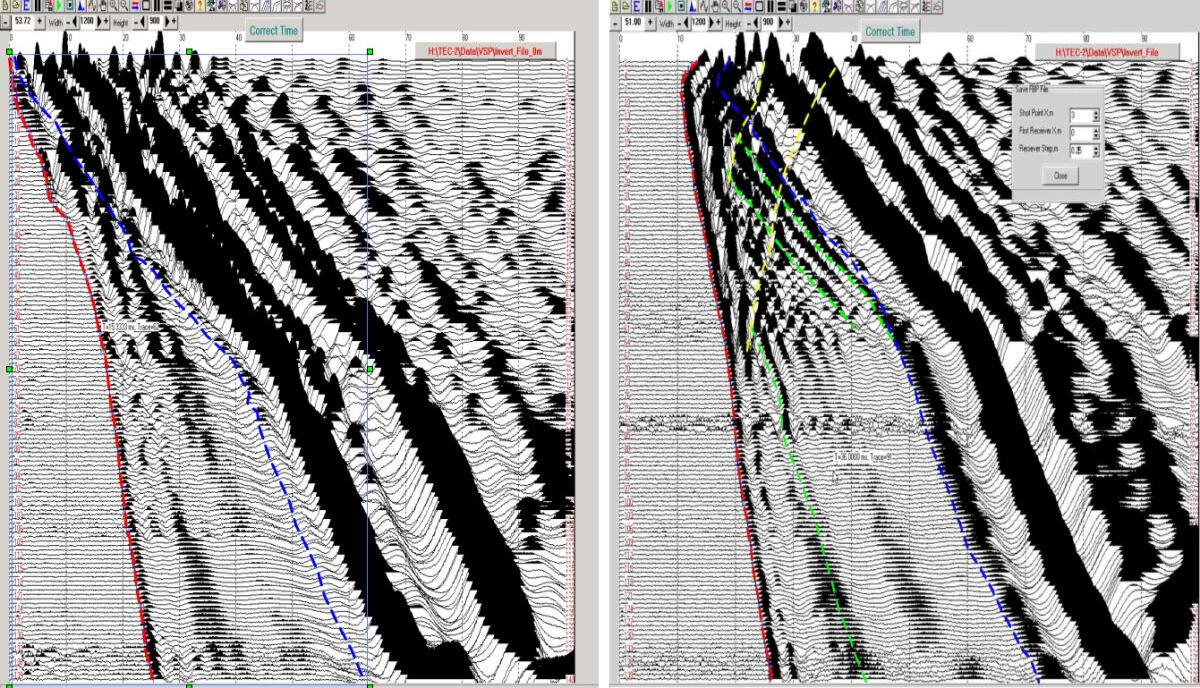
In engineering seismic exploration, using the simplest surface sources of elastic waves, more than 85 percent of the impact energy is spent on the formation of low-frequency and low-velocity surface waves. The following seismogram, obtained on the asphalt pavement of the embankment with an 8 kg sledge hammer pulse, illustrates the dominance of low-velocity surface waves in relation to refracted and reflected waves. Being the strongest hindrances for the method of reflected waves, Rayleigh surface waves at the same time contain very valuable information for the study of soil properties about the velocity of propagation of transverse waves.The most advanced and rapidly developing at present in shallow seismics methods of processing based on multi-channel analysis of surface waves (MASW), gives quite a detailed one and two - dimensional model of shear wave velocities Vs distribution in the soil mass. A natural limitation of the MASW technique is a small depth of penetration of the surface wave energy into the soil massif thickness. An essential factor for increasing the depth of the method is the possibility of attracting passive low-frequency noise of transport and operating mechanisms for joint analysis with the records obtained in the active mode.
Selection of dispersion curves of Rayleigh surface waves phase velocities and construction of a single-dimensional model of transverse wave propagation velocities
The main precondition for multichannel frequency analysis is the predominance of the energy components of transverse displacements during propagation of oscillations along the surface of the media and frequency dispersion of phase velocities – an increase of visible period and, accordingly, an increase of the penetration depth of surface wave energy into the thickness of the soil massif. The matrix of phase velocities of several Rayleigh surface wave modes characterizing strong frequency dispersion of phase velocities is shown below. The dispersion curves of the zero, first and second harmonics of the surface wave are used for calculation of the transverse wave velocities model.The above results of multichannel analysis of surface waves are obtained using RadExPro software complex (Deco-Geophysics, Moscow).
Assessment of soil physical properties on the basis of complex interpretation of longitudinal and transverse wave velocities
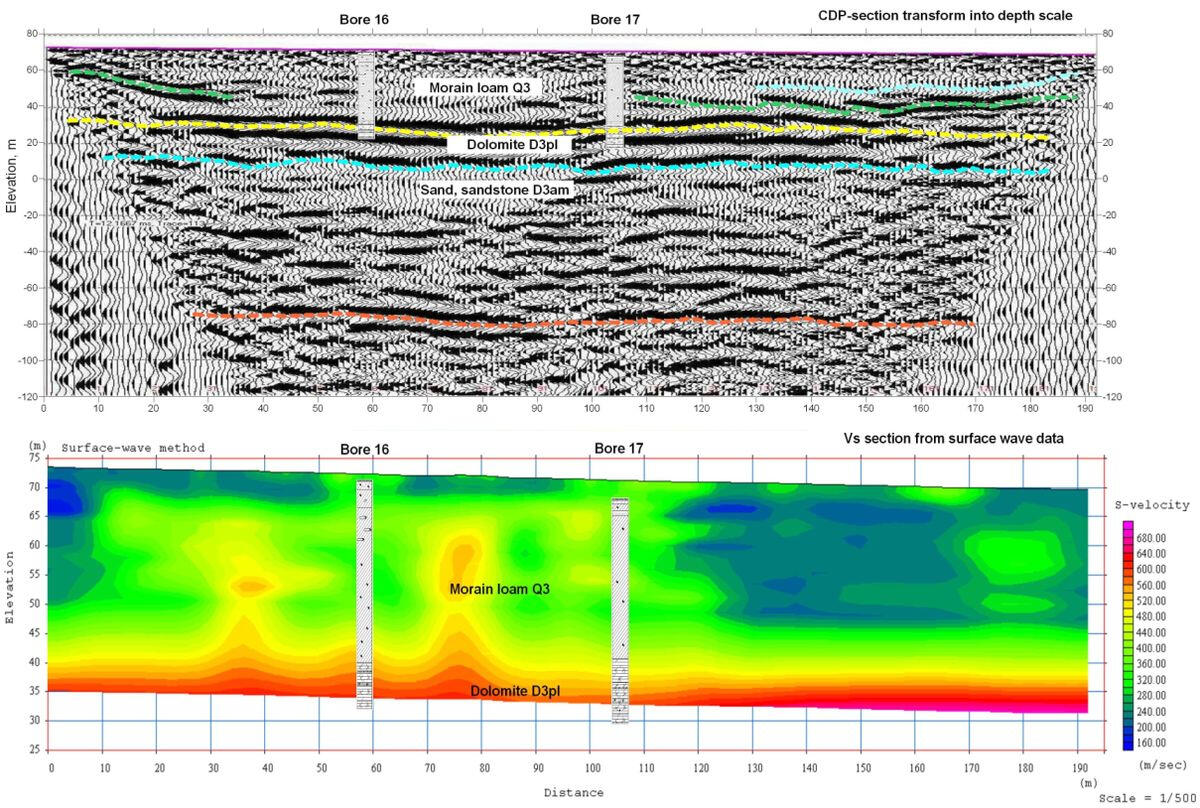
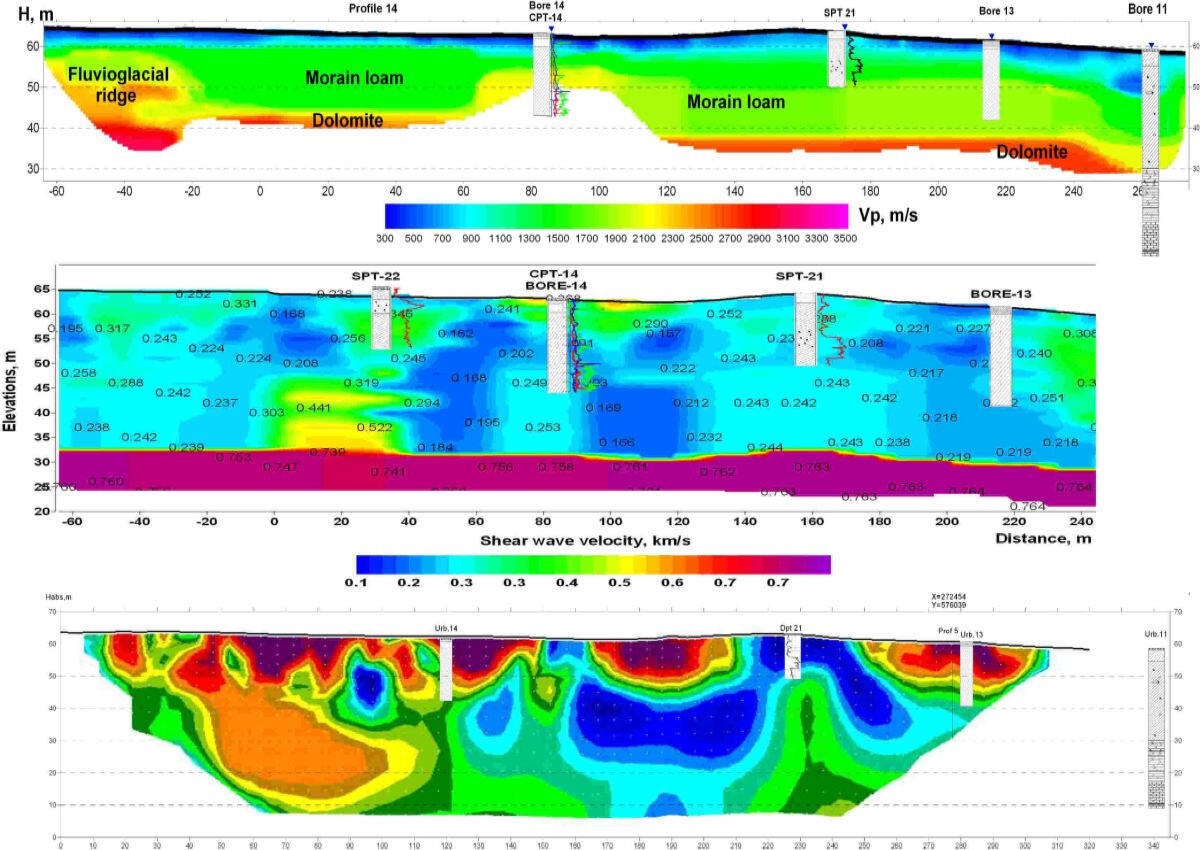
The sections shown in the figure characterize the typical ratio of representativeness of geotechnical methods, drilling and geophysics in assessing the physical properties of the soil massiif. Despite the relatively high density of drilling points and dynamic penetration testing, they do not provide detailed spatial configuration presentation of the boundaries of engineering-geological elements within a relatively homogeneous array of moraine loams. At the same time, the transverse wave velocities, which characterize, first of all, the properties of the soil skeleton, give a clear spatial picture of the distribution in the moraine loams of large-block fraction clusters (moraine ridges) with increased velocity of the transverse wave propagation.In geotechnical surveys, several types of waves are usually used to assess the state and properties of the soil massif and its saturated fluids: longitudinal reflected, refracted and surface waves. The following figure shows the types of seismic sections in one of the profiles in the central part of Latvia. In the upper part of the section up to 35 m of moraine loams lies, then about 20 m of Plavinian dolomites, below- the upper devonian sediments - Amata-Gauja sandstones lie. At a depth of 160 m (both sections in the depth scale) on the CDP section a fairly well-correlated boundary follows, perhaps the bed of the Amata-Gauja sandstones.These materials obtained with the use of 8 kg sledge hammers and a single 64-channel receiving arrangement of geophones with a step of 2 m. However, the complexity of the field work and data processing for these sections varies considerably. So, if during obtaining of CDP cross-section by the reflected waves, the interval between shot points was 2 m, to obtain velocity sections from refracted and surface waves were used only seismograms that were obtained with a step of shot points along the profile 16 m.
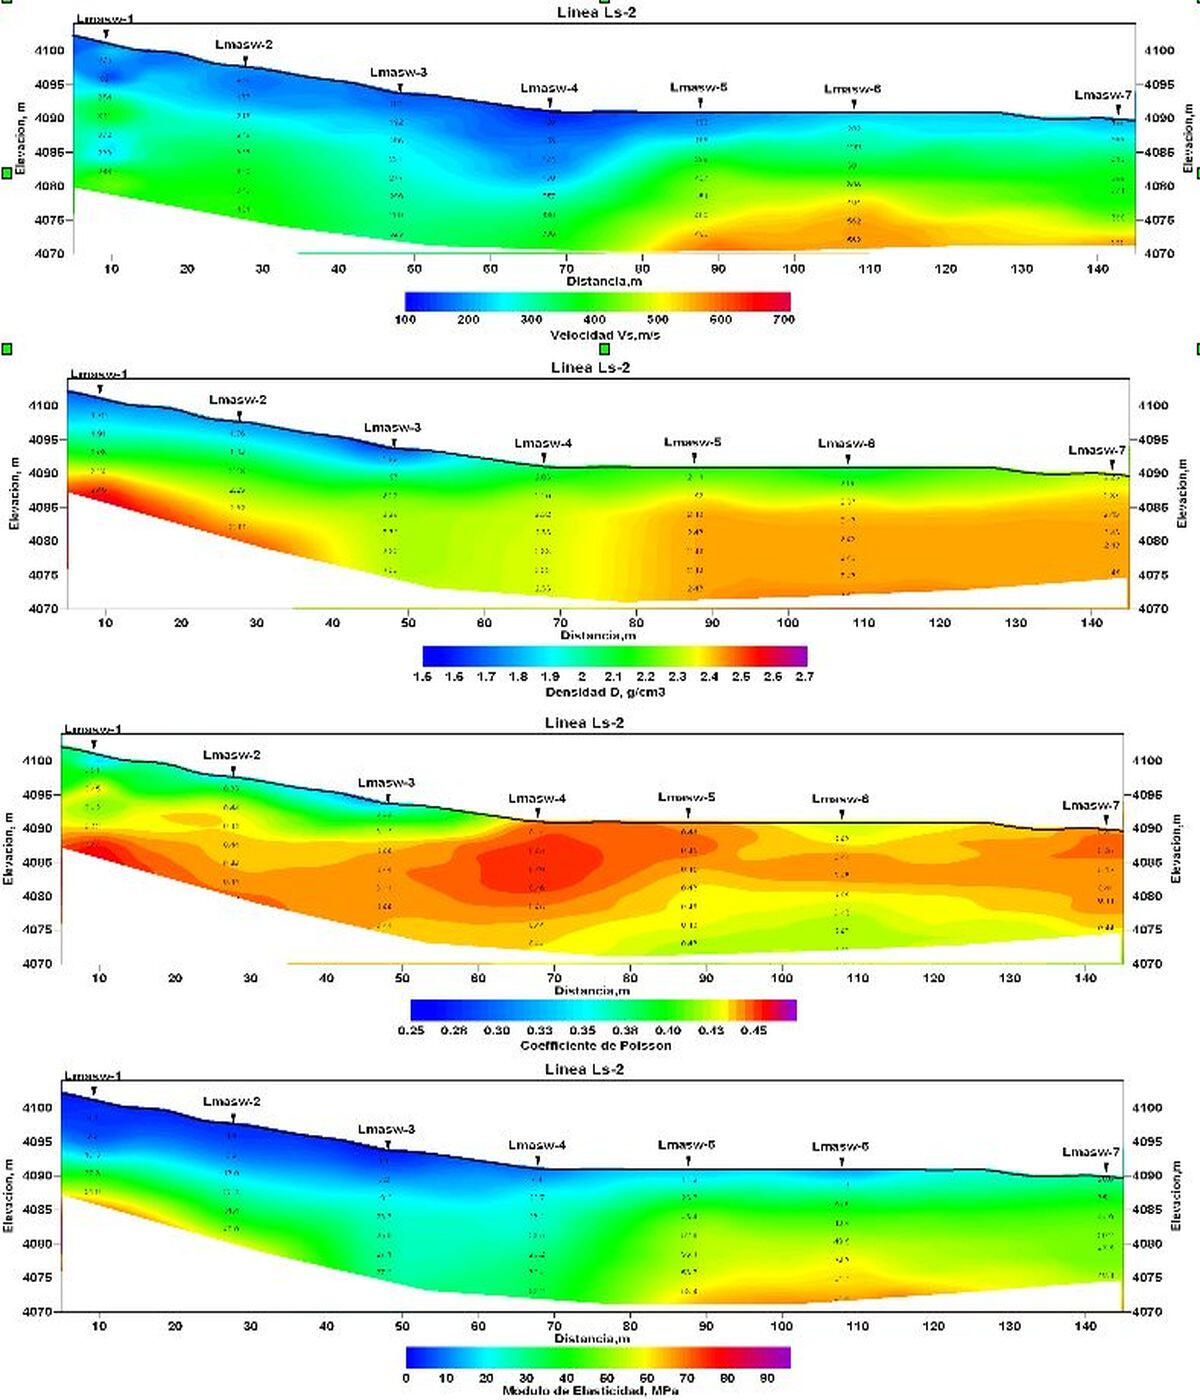
Calculation of the sections of soil physical properties on high mountain deposits of placer gold in Chucapaca (department Moqeguia, Peru)
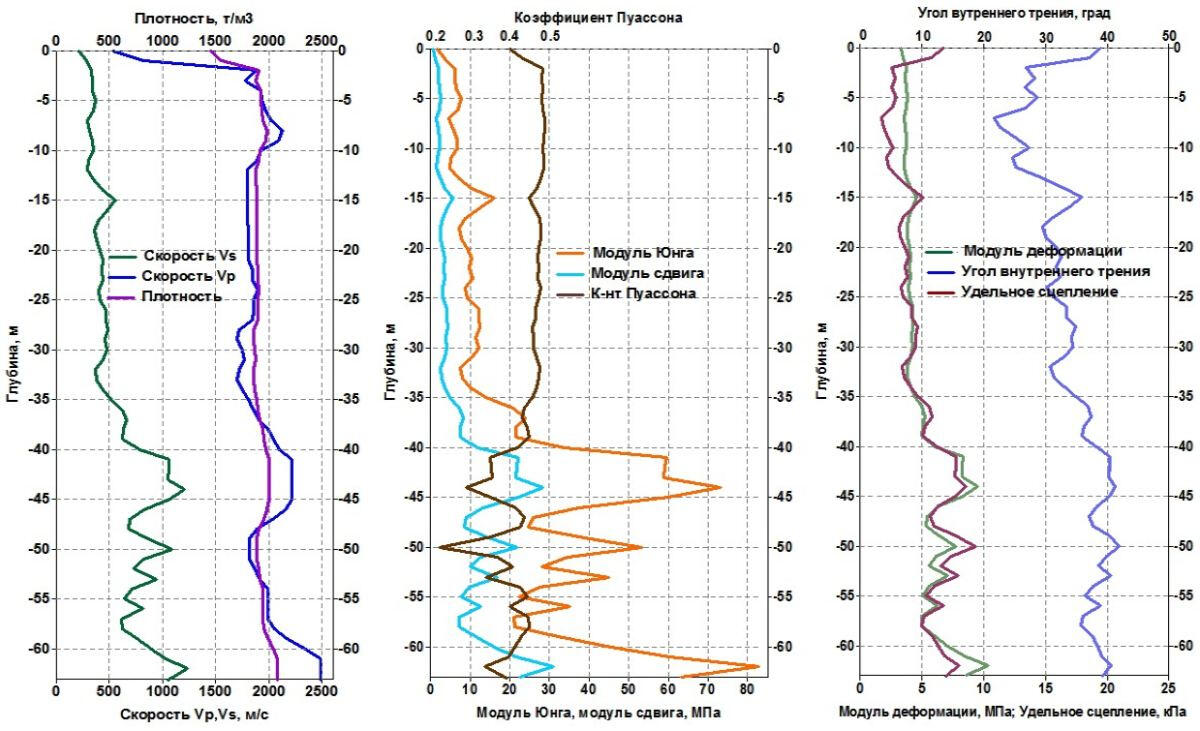
Examples of determining of transverse waves propagation velocity according to MASW and prediction of physical and mechanical properties of soils using the method of refracted waves along one of the lines of the working of the gold-bearing field in the South of Peru are shown in the following figure.Based on the longitudinal waves propagation velocity sections obtained from first arrivals of refracted waves and transverse wave velocities from MASW method the sections of the forecast density, Poisson's ratio and elastic modulus are calculated along one of profile at the site of placer gold deposits working (Chucapaca, department Moquegua, Peru).
Vertical seismoacoustic profiling (VSP)
Purpose
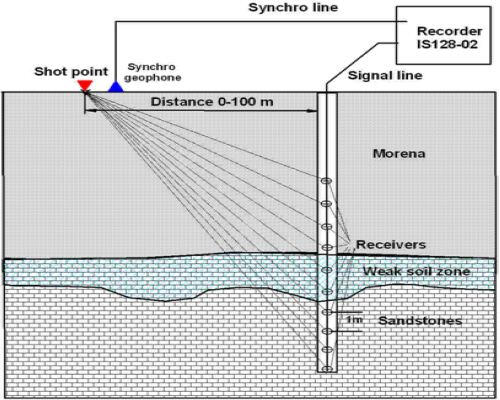
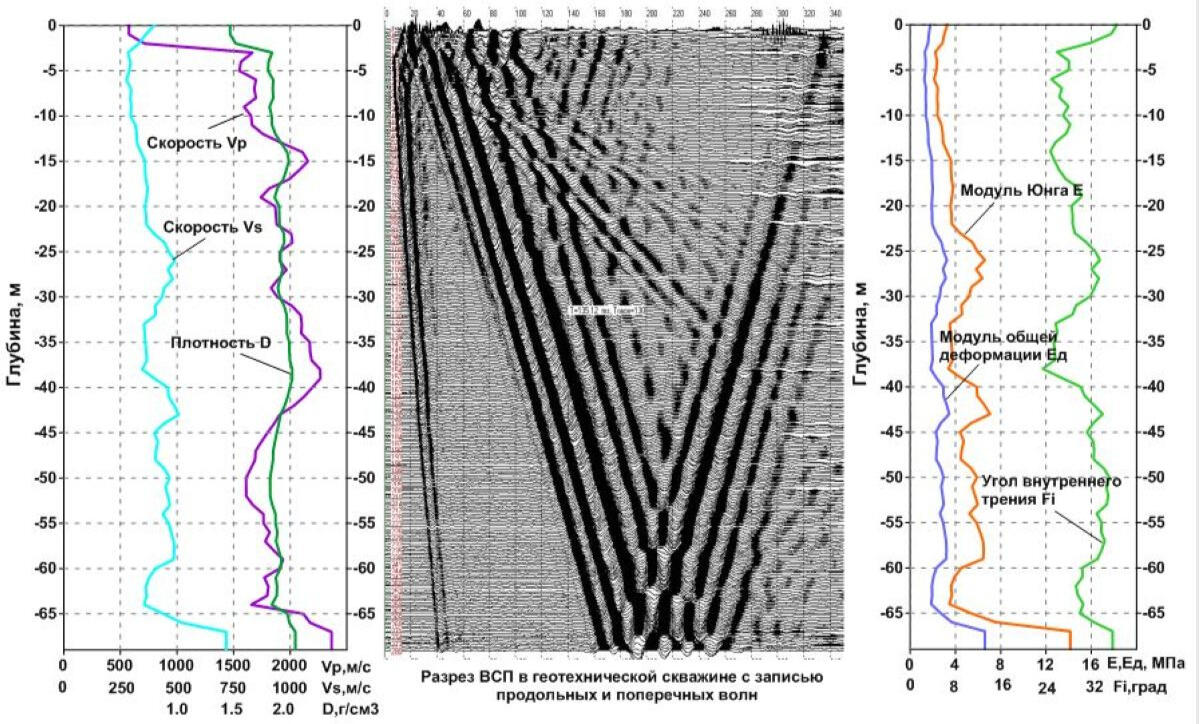
Vertical seismoacoustic profiling (VSP) in shallow geotechnical wells is used to solve various problems - to obtain static corrections for the zone of low velocities during conventional seismic exploration for oil and gas, to bind reflections on sections of shallowl-depth seismic CDP exploration, to obtain detailed sections of elastic modules and forecast estimates of strength and deformation properties of soils.
VSP layout
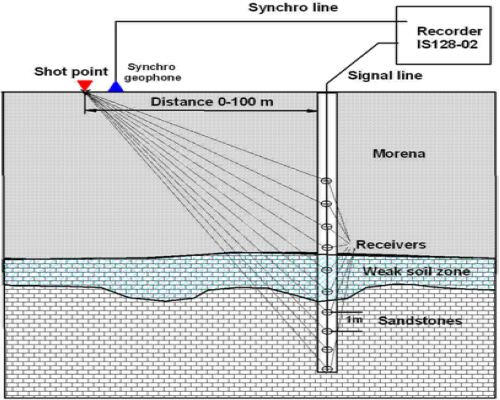
Usually for reception of oscillations piezo-hydrophone multichannel (8-24 channel) piezo-probe is used. Works are carried out with a pulse shock source (sledge hammer). At low groundwater level, the well is cased by a column of polyethylene pipes with a diameter of 100-105 mm with a check valve at the bottom of the column. In this case, the well can be filled with water up to the earth’s surface, protected from collapses and used for repeated observations. Removal of the source from the wellhead 3-100 m. The estimated records parameters can be following: sample rate 100-200 µs, and the number of samples 1000-2000, the recording duration 100-400 ms.
An example of a VSP recording in a 65 m deep borehole to determine static corrections for conventional CDP seismic surveys
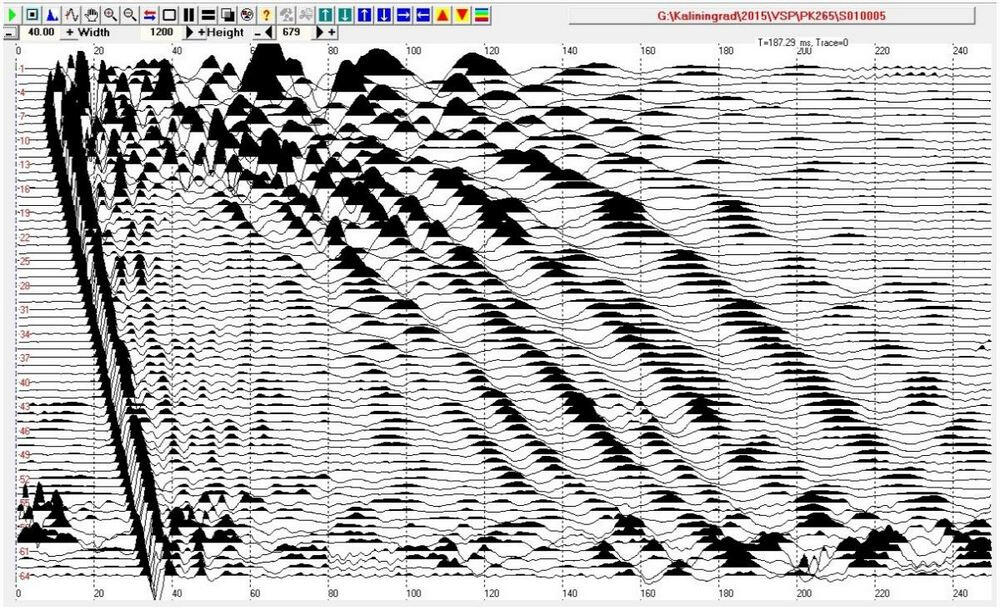
VSP section obtained at registration of oscillations in the well using 8-channel probe with a piezoelectric pressure sensors. The step of receivers is 1 m, the shot point removal from the wellhead is 5 m. Along with the first breaks of the direct longitudinal wave, a low-frequency low-velocity hydro wave is registered
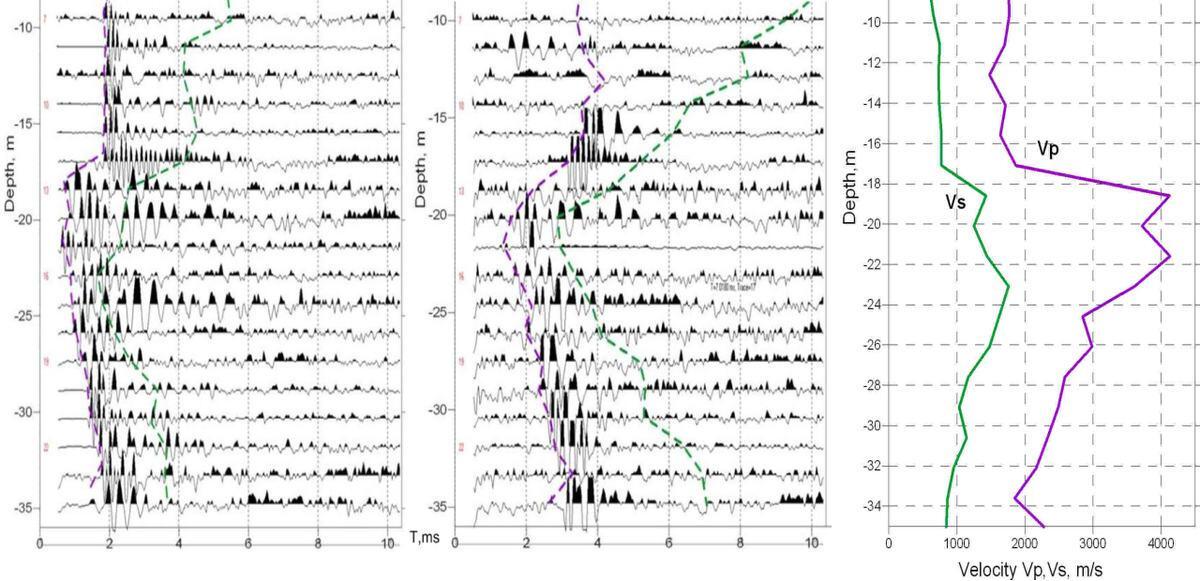
VSP sections with a step between seismic routes of 25 cm, obtained in a well with a depth of 35 m at the location of the source at the wellhead(left) and at a distance of 6 m from the wellhead (right)
Traditionally, the distance between the hydrophone channels in the probe is 1 m. If it is needed more detailed data, for example with a step size of 0.25 m 4 series of excitations are performed with the movement of the probe each time for 25 cm up the well bore. After that, the probe moves up to its full length from the initial position of + 1m and the following 4 series of excitations and registrations are performed. The treatment program compiles a summary VSP seismogram with increments between receivers 25 cm. With this rate of the times at the vertical hodograph it is possible to obtain an elastic waves velocity section, approaching on detail level to the charts of cone penetration testing (CPT).
Graphs of physical and mechanical parameters of soils obtained on the basis of VSP
Longitudinal wave velocity is determined by the first breaks of the direct (downgoing) wave. To determine the transverse wave velocity in conditions of section, presents a thick layer of loose Quaternary and moraine soils in water-filled wells with high enough precision, it is possible to use the hydrowave velocity recorded by piezo-hydrophone pressure sensors by a simple method without using th three-component probes.
Crosshole seismoacoustics
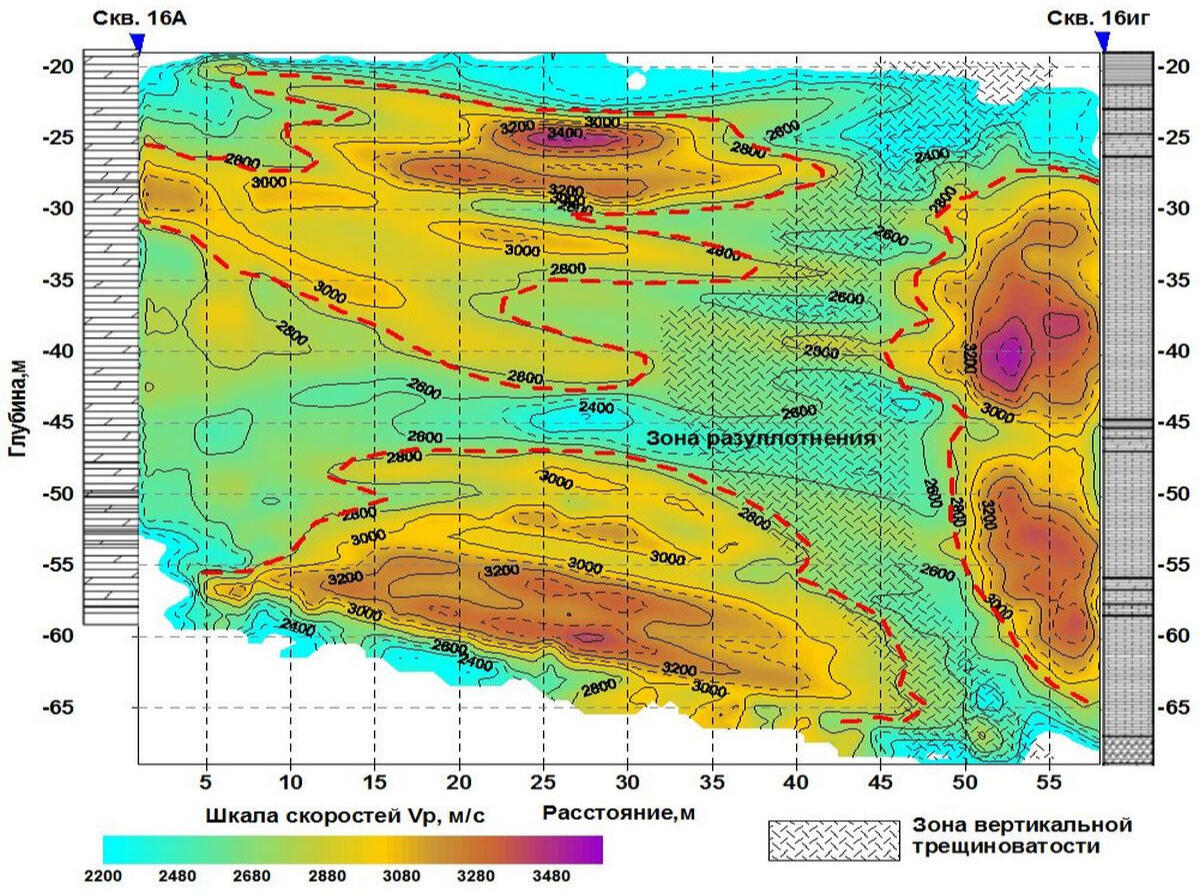
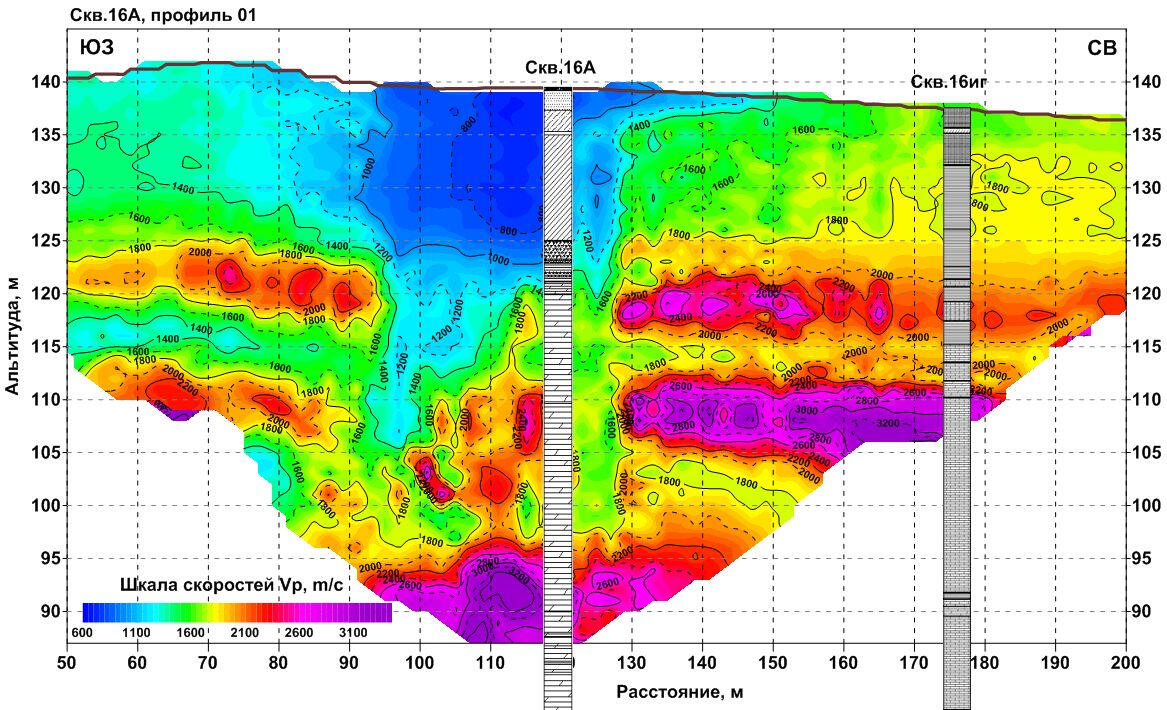
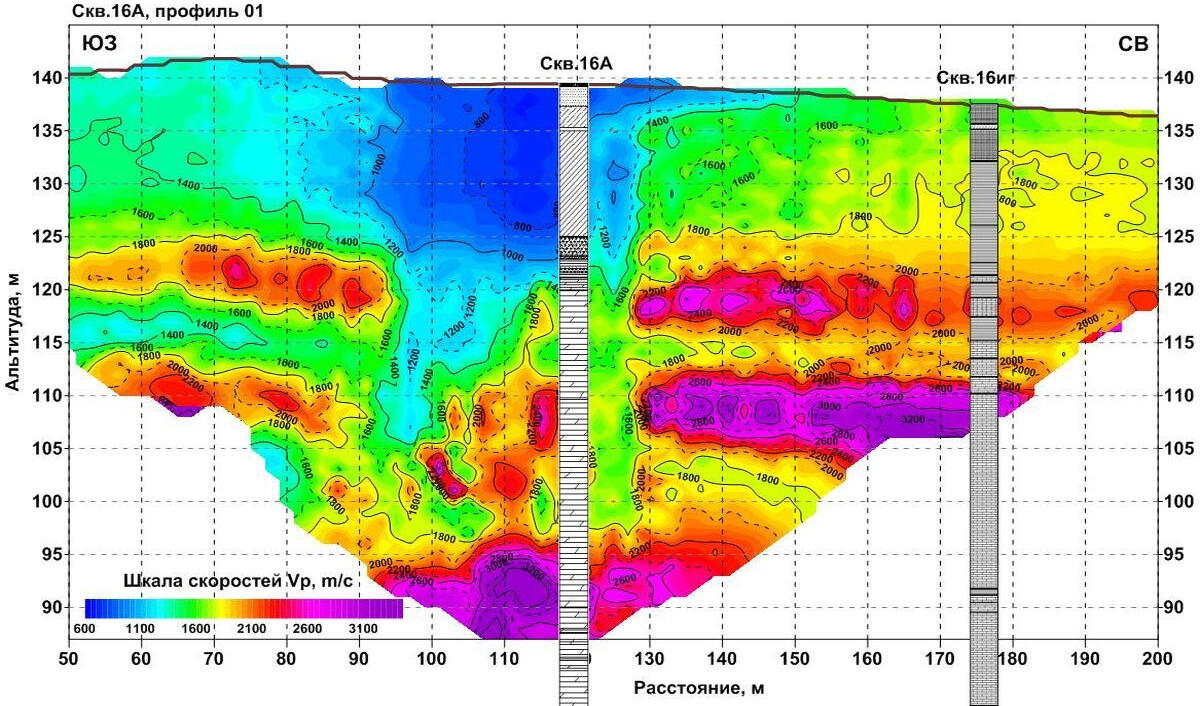
Velocity section obtained during the sounding between the open wellbores in the interval of depths from 19 to 69 m. The section represents the superposition of two tomographic images obtained by the counter transmission between boreholes 16A and 16ig.
Seismic acoustic sounding according to ASTM d 4428/D standards
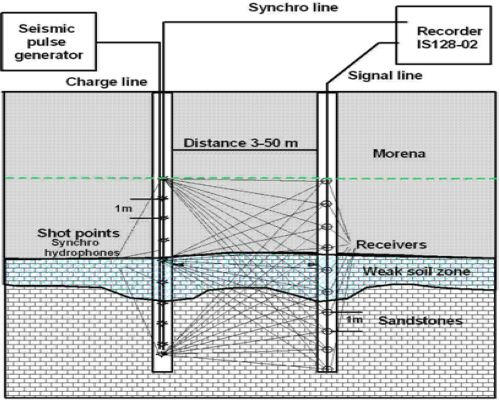
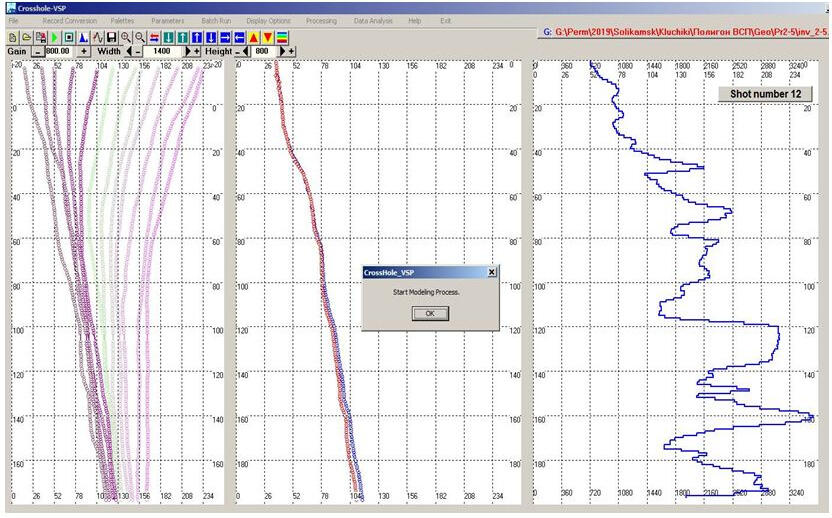
Measurements are carried out in three wells drilled at a distance of 3 m from each other along the same line. Wells are cased with polyethylene pipes with a check valve at the bottom of the casing and filled with water. The space between the case and borehole walls is tamponed by clay, or cement, or filled with water. During the measurement, the pulse emitter and receiver are lowered into adjacent wells to the same depth, provided by the technical specifications, a series of pulse excitations and recording of the stacking signal are performed, and then the emitter and receiver are moved to new positions. The first time the emitter and receiver are lowered to the depth of the water level in the wells, then moved down the trunk at intervals of 1.0-1.5 m, as provided by the specification. In accordance with the standard ASTM D 4428/D 4428M-07 in single channel mode, there are two or three series of measurements of longitudinal and transverse waves travel times: with the location of the emitter in the well 1, and receivers in the borehole 2 at a distance of 3 m and in well 3 at a distance of 6 m from the borehole 1. of the Acoustic pulse start synchronizes with the beginning of the recording by the starting piezoelectric transducer, placed in one container with emitter and connected to the data logger via a communication line.The figure shows the records obtained from the piezoceramic emitter with a pulse frequency of 4 kHz with an accumulation of 20 actions in each series of measurements. Measurements were made on the basis of 3 m (left) and 6 m (right). The first breaks of a direct longitudinal wave on the most part of the investigated depth interval are traced on the records. In the thickness of dolomites at a depth of more than 18 m signal-to-noise ratio reaches values of 20-30. In the upper part of the section, the conditions for signal passing deteriorate dramatically. Also the arrivals of the shear wave are not enough confident in many of the intervals.
Seismic acoustic sounding in a multi-channel mode
The receiving of oscillations is performed by a multichannel (8 to 24 channels) piezo-hydrophone probe into the observation well. The requirements for the arrangement of observation wells in this case remain the same as for measurements according to ASTM D,-4428/D standards.If it is impossible to use polyethylene pipes for casing and in case of partial replacement with steel ones in the upper collapsing intervals of the ground array, the observations are carried out in the intervals of open well trunk to the level of filling them with water. A more powerful electric spark type emitter (sparker) with discharge energy of the order of 1-1.5 kJ moves with a given step along the trunk of the neighboring well, as a rule, for the entire length of the studied interval. If necessary to study the geological section interval, exceeding the length of the receiving probe, the probe is moved along the trunk of the observation well to a new position, and a series of pulse excitations with the movement of the source along the well is repeated.
Seismoacoustic sounding and calculation of tomographic sections of velocities
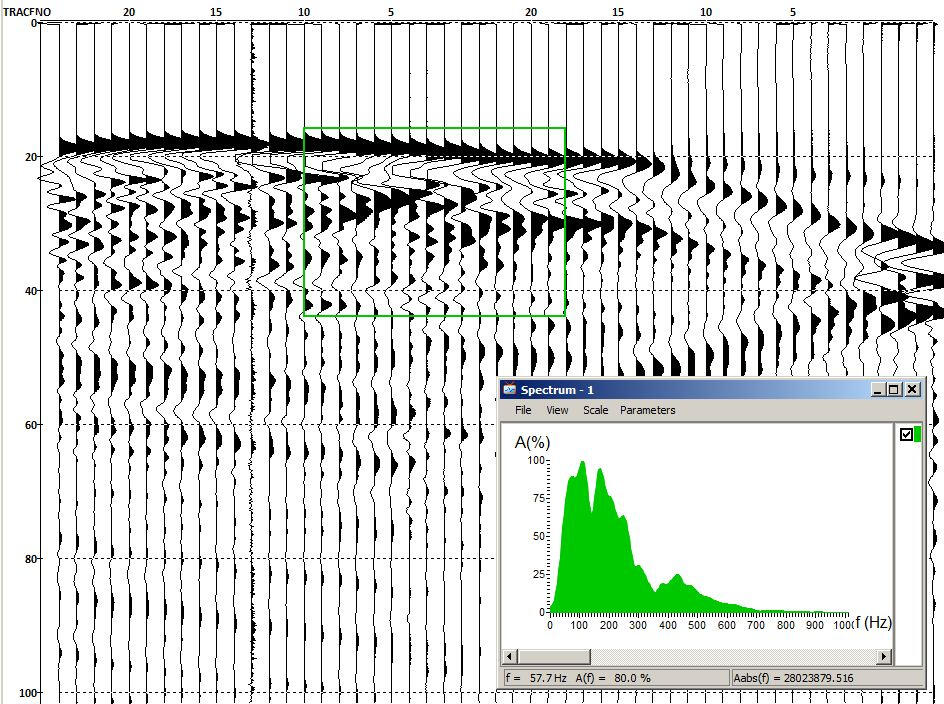
Processing of the seismic records shown below and calculation of tomographic sections are executed on the materials submitted by department of active seismoacoustics of the Mining Institute of UB RAS (Perm).When using an electric spark source with a accumulated charge energy of about 1000 J, it is possible to reliably register signals in wells at distances up to 100 meters and more. At the same time, due to the attenuation of the high-frequency components of the signal in the soils, the central band of the operating frequencies of emitted signal spectrum of the 1000-1600 Hz is narrowed to 100-400 Hz.Acoustic sounding is performed with mutual replacement of the emitters and receivers arrangement in two bores. Observations are made using different energies - 600 J and 1000 J, and, respectively, at different central frequencies of emitted pulses. Nevertheless, the high convergence of tomographic images in counter-transmission is obtained, both in absolute values of velocities and in the location of local anomalies of velocities. This makes it possible to conclude that the low-velocity anomalous zones revealed in the section adequately reflect the features of the structure and physical properties of soils and rocks at the site of sounding.
Examples of tomographic sections of P-wave velocities
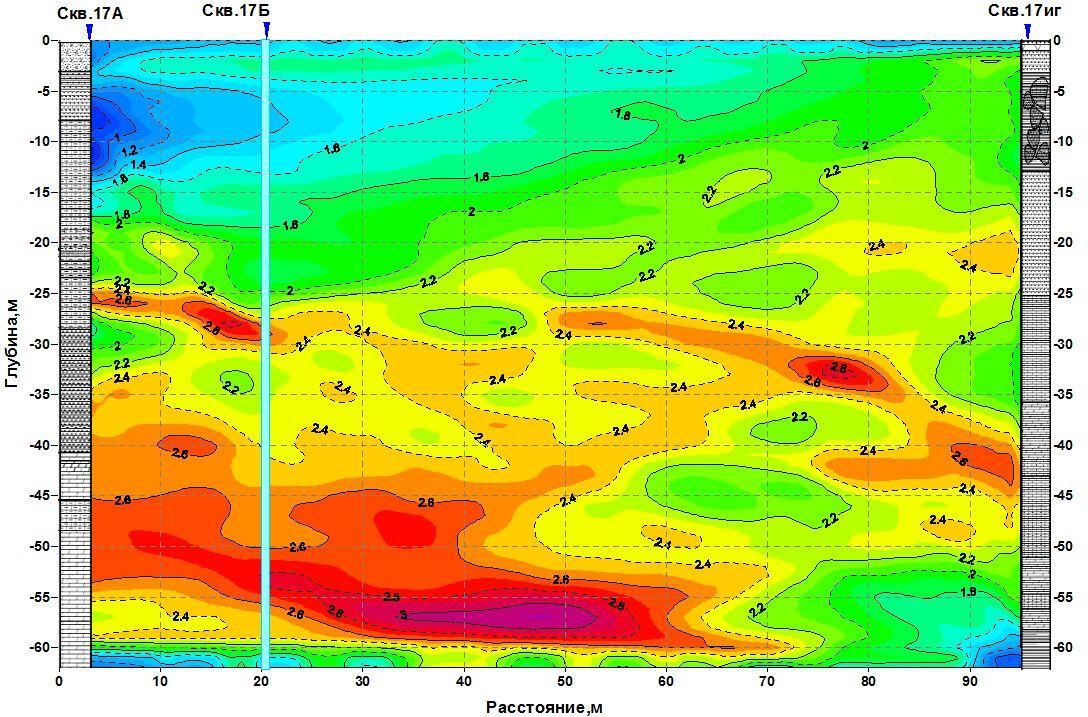
Summary tomographic section of velocities obtained by radiation in borehole 17A and reception of signals in borehole 17B at a distance of 20 m and in borehole 17ig at a distance of 96 m.
Non-longitudinal vertical seismic profiling
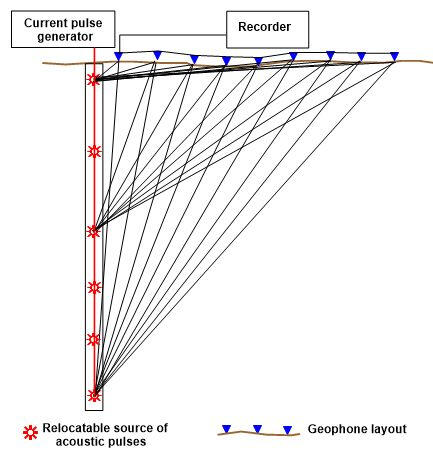
Scheme for direct non-longitudinal VSP observation
Non-longitudinal VSP, depending on deep and near-surface seismic-geological conditions, surface topography and terrain permeability, can be performed in two reciprocal versions - direct and reverse.Direct non-longitudinal vertical seismic profiling (NVSP) in wells is performed using ground sources of acoustic pulses (shock, powder, vibration). The sources are located along randomly oriented lines on the surface. The vibrations are received using multichannel piezoreceiving probes placed in water-filled wells.
Scheme for reverse non-longitudinal VSP observation
In the reverse version, vertical profiling is performed using a borehole pulse source and ground geophone receiving lines. At the same time, signals can be received in adjacent wells using multichannel piezoreceiving probes. An electric spark source consisting of a current pulse generator and a multielectrode emitter placed in a sealed container filled with salt water is used as a source of acoustic pulses. The accumulated electrical energy of radiation is about 1.0 -2.5 kJ. The step of moving the emitter along the wellbore from bottom to top is 1-5 m.
Due to the equivalence of seismic ray trajectories, data processing in both profiling options is carried out using the same algorithms.
Scheme for testing area VSP profiles
A system of non-longitudinal VSP, carried out along a linear profile using several differently spaced excitation points, or an equivalent inverted VSP system, can be transformed into an area system of non-longitudinal VSP with profiles located along several spatially separated lines of excitation points. Profiles of excitation or reception points are located along lines oriented in random order relative to the well. Excitation or reception profiles can be plotted along broken lines. The step of sources or geophones along the profiles is 2-16 m. The maximum distance of sources from the wellhead is determined by the energy of the emitter and the properties of the upper loose part of the soil mass and can reach 150-250 m.Processing of records and calculation of the velocity sections shown below were carried out using inverted VSP materials obtained by the Department of Active Seismoacoustics of the Mining Institute of the Ural Branch of the Russian Academy of Sciences (Perm)
Analysis of the amplitudes and spectral composition of recorded signals with reversed VSP
With reversed VSP, the energy of the acoustic pulse emitted by an electric spark source in a water-filled wellbore turns out to be quite high at distances of up to 120-150 m from the well. The range of offsets in the inverted version is somewhat narrower than when the sources are located on the surface in the direct version of the VSP due to the higher frequency of the generated pulses. The spectrum of the recorded signal near the well has a stable unimodal shape with a maximum at a frequency of about 300-350 Hz. As the receiving channel moves away from the well, additional modes appear in the signal spectrum; the maximum frequencies are recorded in the region of 80-100 Hz. The strong influence of interference manifests itself in recordings at a fairly large distance, more than 60-80 m from the wellhead.
Program for adaptive selection of radial velocities based on hodographs of the first arrivals of a direct wave
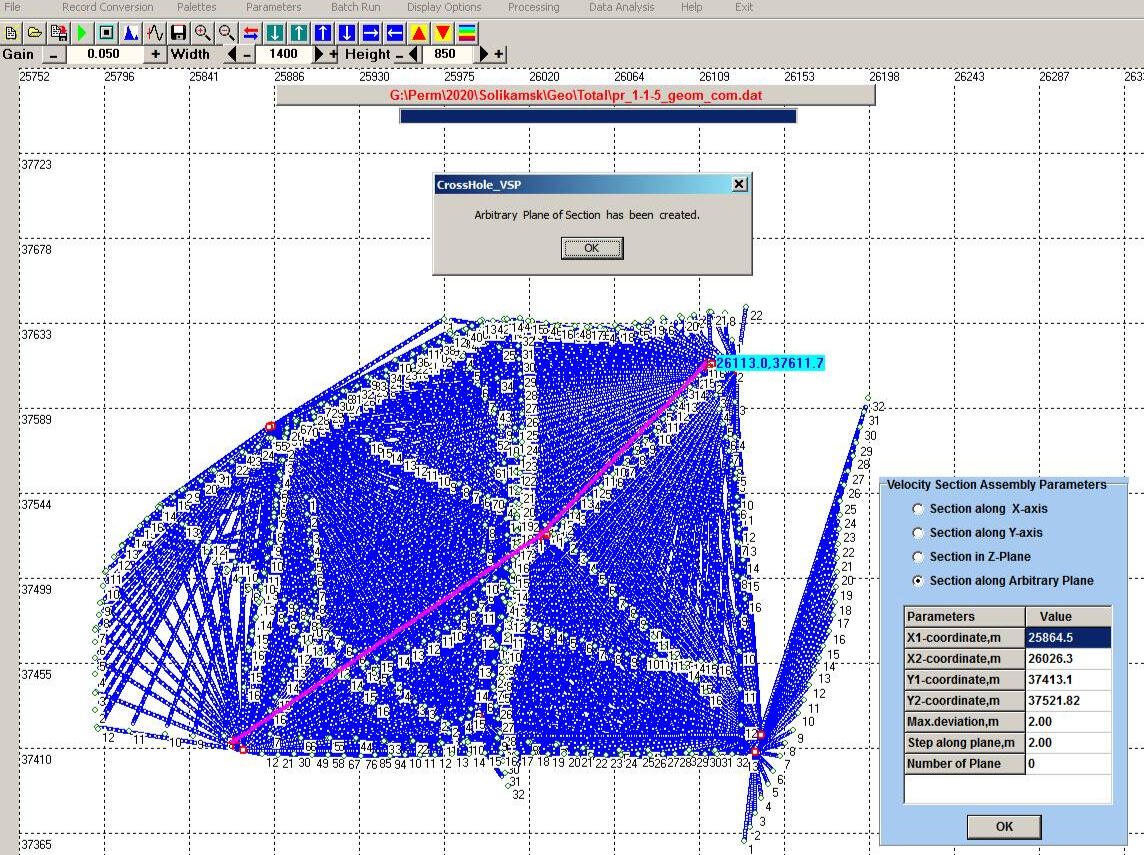
Specialized software is used to process data. The data collection and processing program used in this case forms a spatial sample of coordinated values of the velocities of elastic waves propagation along curvilinear seismic rays. Based on such a sample, vertical and horizontal sections of velocities can be obtained along arbitrarily specified planes, reflecting the spatial distribution of elastic wave velocities in the soil massif.
The algorithm for calculating radial velocities is based on the principle of minimum travel time along the beam between the source and the receiver. The selection of radial velocities is carried out using an iterative algorithm until a given minimum difference in the observed travel time is reached and calculated using a theoretical hodograph for a thin-layered model with an arbitrary lateral distribution of velocities in the layers. The program can be used for reciprocal observation schemes - direct and reverse VSP.
Calculation of field anomalies of first arrival times using a series of profiles on the surface
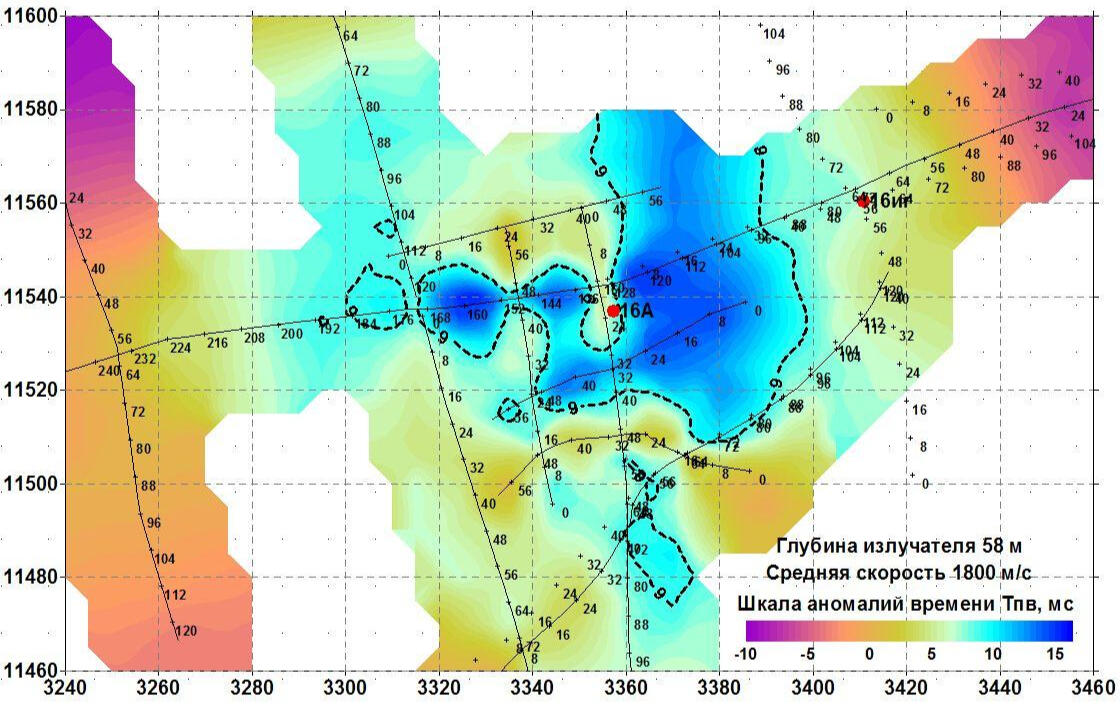
The non-longitudinal VSP data processing program provides calculation of various kinematic and dynamic parameters of the recorded waves. In particular, horizontal sections of the field of first arrival times are calculated for different levels of the source location in the well. Anomalies of this field are a direct and most obvious sign of the presence of local inhomogeneities in the propagation of longitudinal wave velocities in the soil massif.
Calculation of horizontal velocity sections
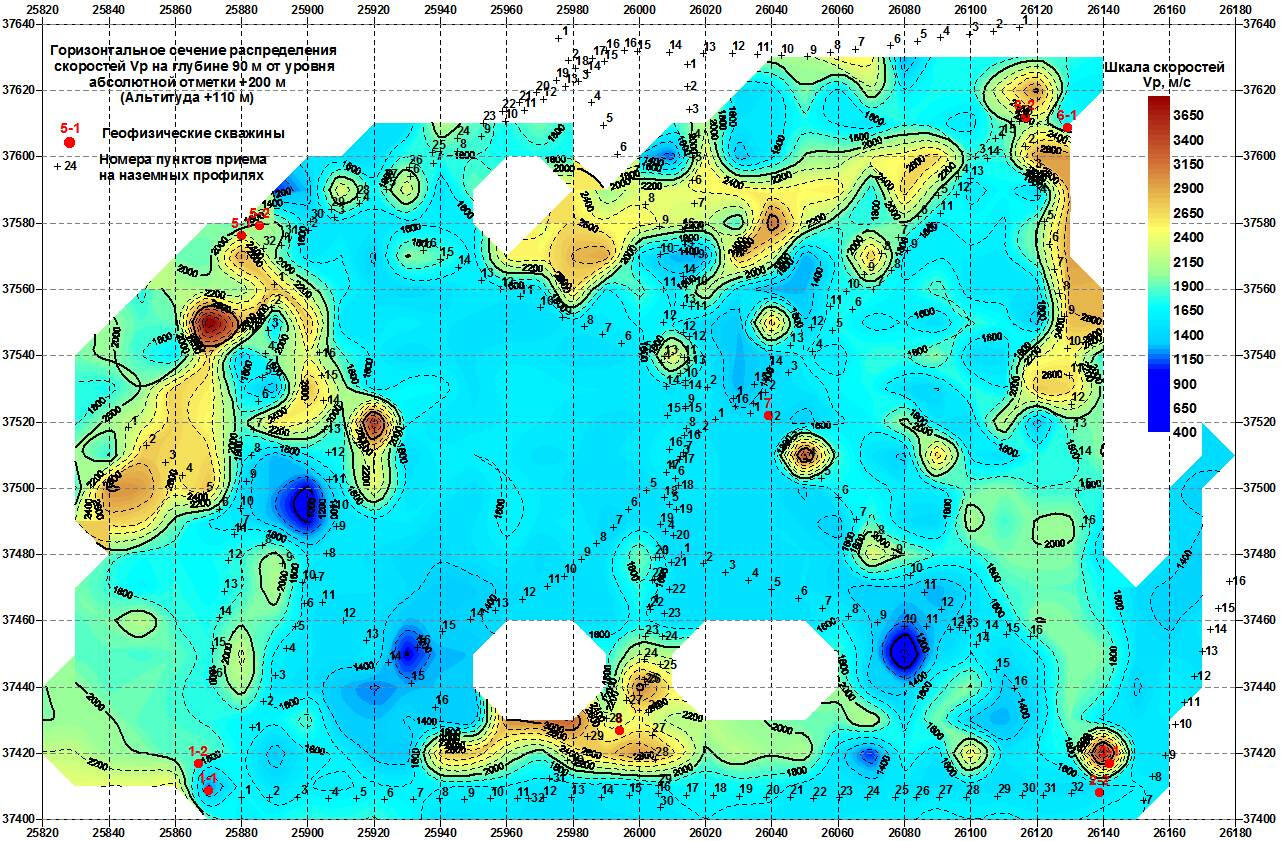
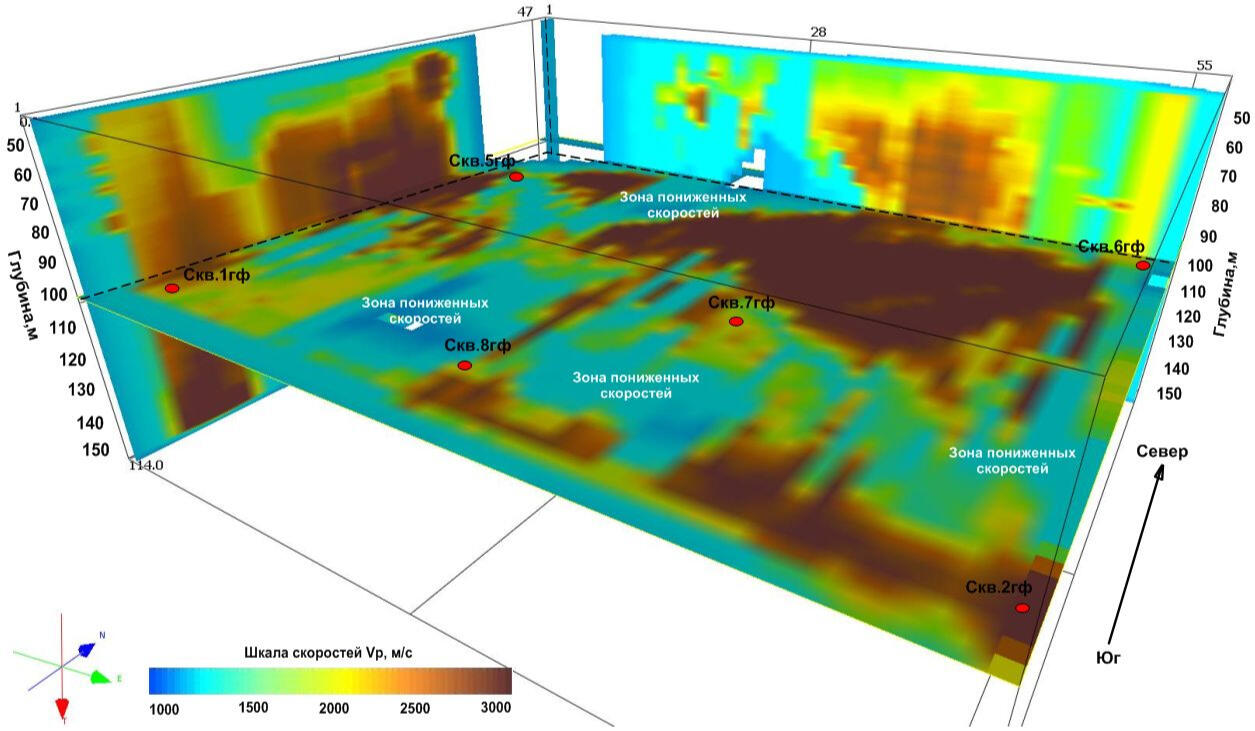
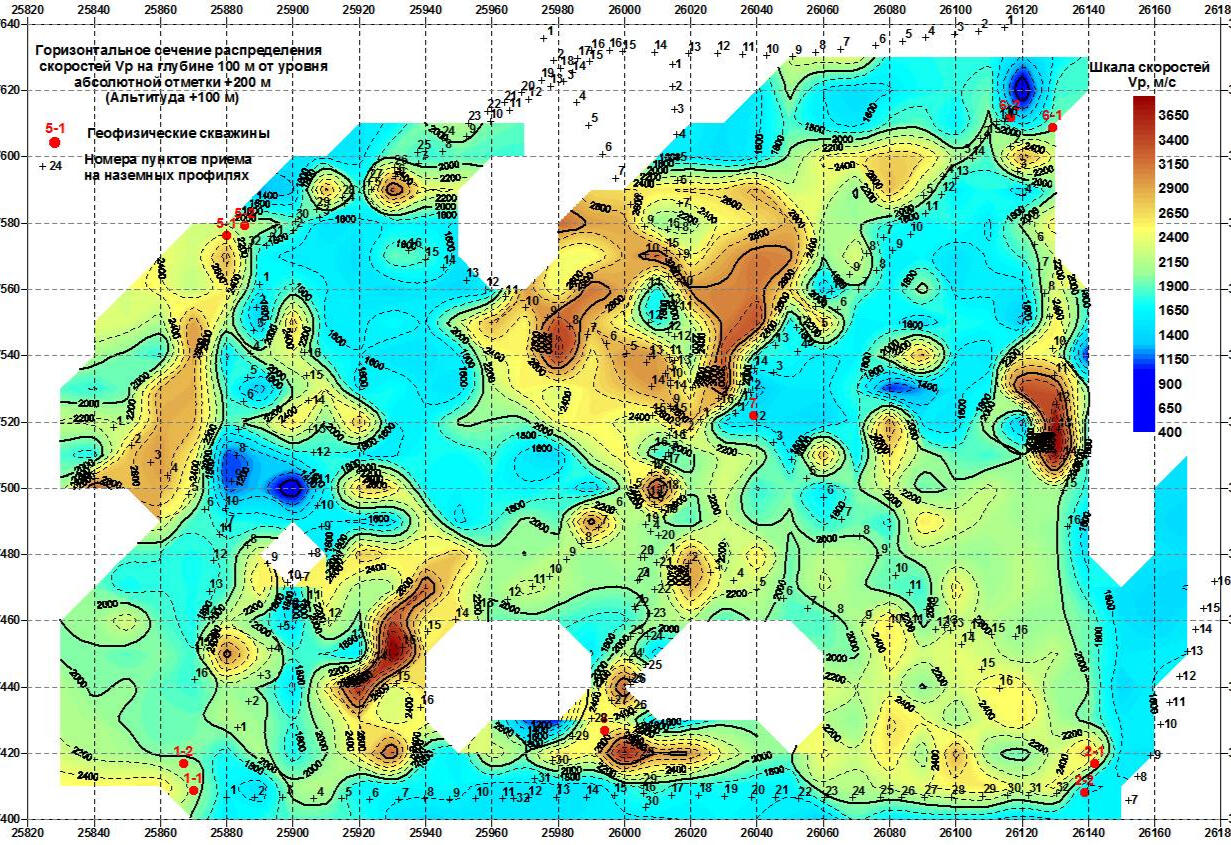
When processing the resulting data array from a set of observation profiles on the surface, a spatial 3-dimensional sample of coordinated velocity values associated with various segments of seismic rays is collected. For geological interpretation of data from this sample, horizontal and vertical velocity sections are calculated, reflecting local heterogeneities of the soil mass and bedrock.The compilation sample for all wells in the polygon is a spatial set of points with velocity values, similar to the velocity cube obtained by processing 3D land seismic data. Subsequent analysis of the velocity distribution in the array is performed using a series of randomly oriented vertical and horizontal sections of the resulting spatial sample. An example of such a horizontal section at an absolute elevation of +100 m (approximately at a depth of 100 m from the surface) is shown in the figure on the left.
Calculation of velocity sections along an arbitrarily specified series of vertical planes
Vertical sections of velocities can be made along arbitrarily specified combinations of vertical planes, the projections of which onto the day surface have the form of a broken line. In some cases, it may be advisable to construct a section along an inclined plane cutting a spatial sample of coordinated velocity values at an arbitrarily given angle.
The figure shows an example of a vertical section of longitudinal wave velocities along a profile passing through two geotechnical wells, one of which is located in a zone of accelerated subsidence of the earth's surface above a water-logged mine opening in the salt column.
Construction of a velocity cube Vp based on non-longitudinal vertical seismoacoustic profiling data
Using this observation system, it is possible to obtain the distribution of elastic wave velocities in the near-well space, which has the shape of an inverted pyramid with the base on the observation surface. As you approach the well, the depth of the studied area of space increases, but its transverse dimensions in the horizontal plane decrease.The cube of velocities of propagation of longitudinal waves is constructed on the basis of a spatially coordinated sample of calculated velocities at the boundaries of thin layers at the points of refraction of seismic rays from sources on the surface to receivers in wells. Thus, it represents a generalized model of the distribution of true velocities in the near-wellbore space.The given sections of the data cube are not intended for use in any documented applications - sections, maps, etc. Their purpose is to provide a visual representation of the localization, size and configuration of possible large velocity anomalies in the rock mass at the test site.
Measurement of soil and structures vibration
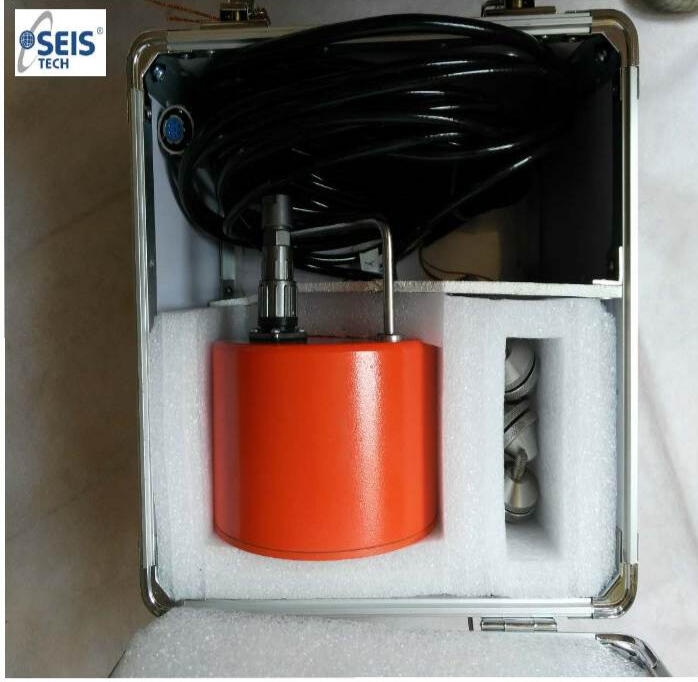
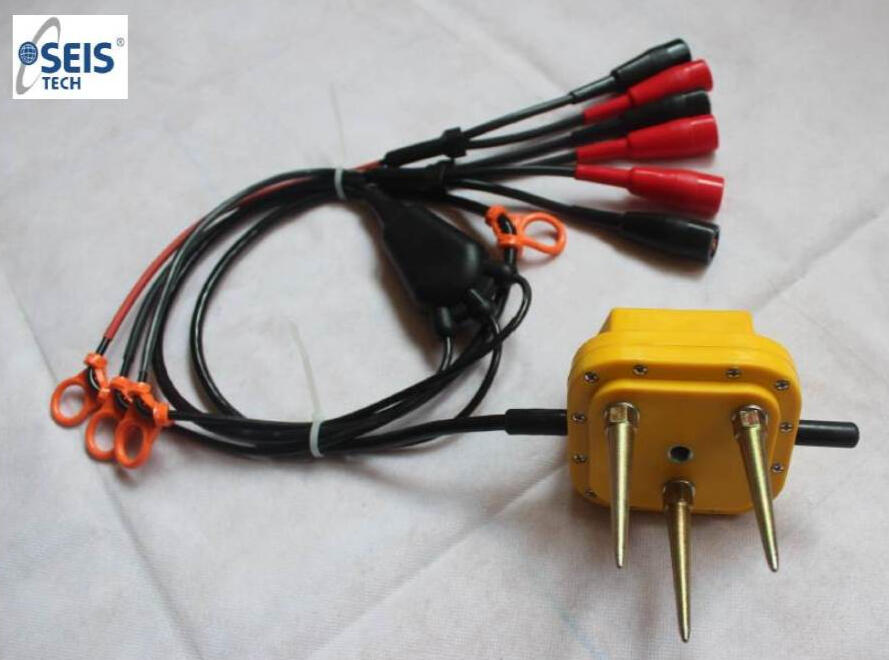
Study of sources and spectral composition of vibrations at the construction site
An important factor in the vibration resistance of a structure is the ratio of its own resonant frequencies and the predominant vibration frequencies propagating in the base soil mass.Vibration measurements are performed with three-component displacement sensors or accelerometers in passive mode. Spectral analysis of records obtained over fairly long periods of time (minutes, tens of minutes) in various parts of a building or project construction site makes it possible to identify the maximum frequencies of various vibration modes and their sources (microseisms, transport noise, vibrations of operating mechanisms).
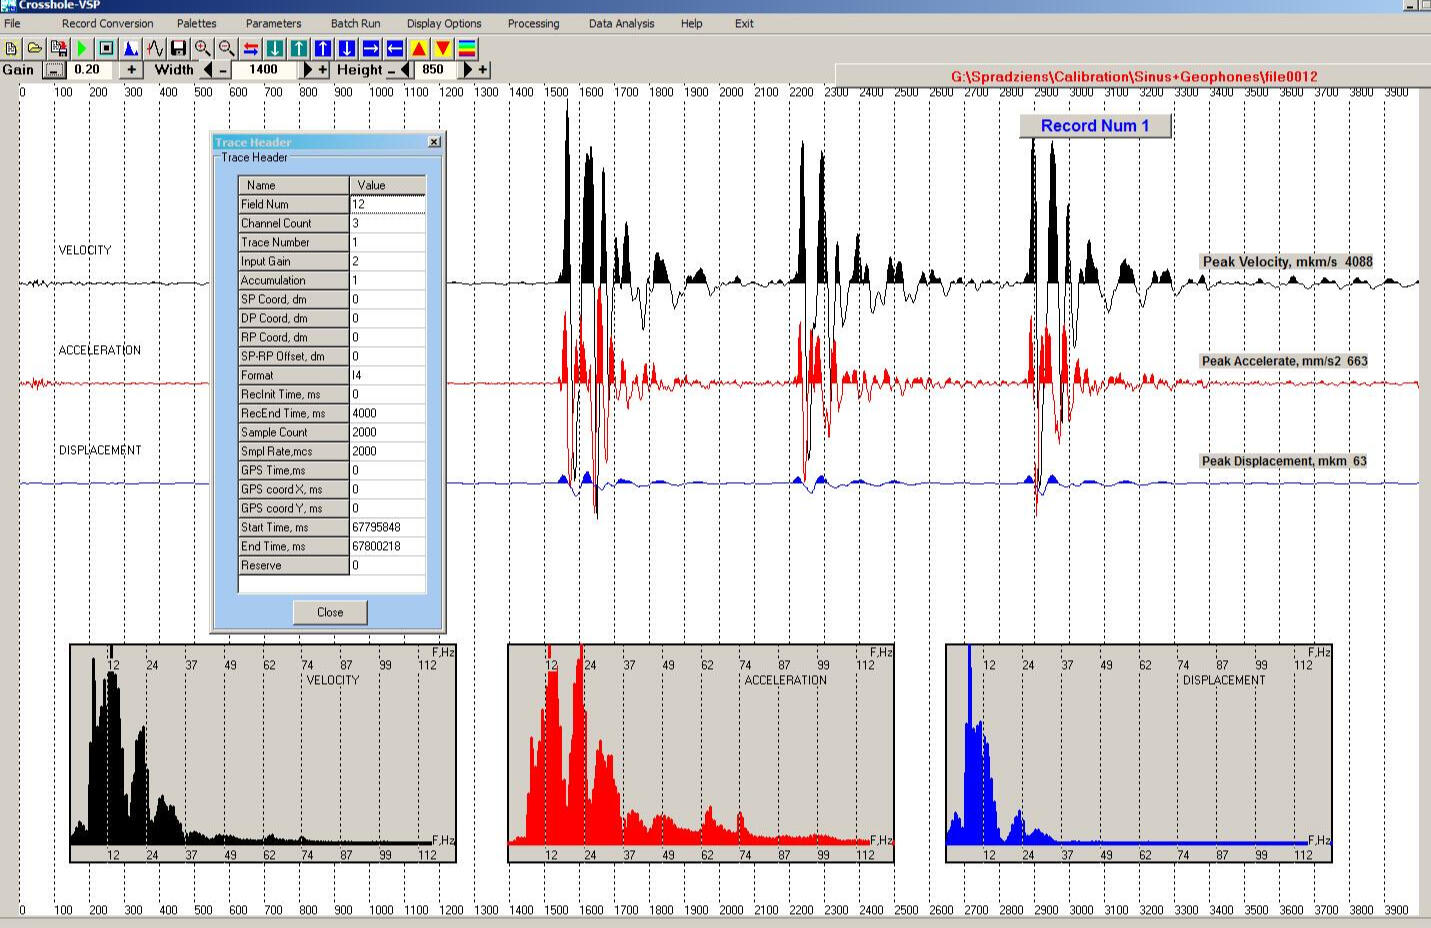
Vibrations of soil foundations under the influence of road transport
The most common type of vibration impacts is traffic noise. The spectral composition of the vertical and horizontal components of vibrations in a soil mass during the passage of waves from motor vehicles differs significantly.The spectra of horizontal components are significantly enriched in low frequencies, which are the most dangerous for the foundations of structures. However, the amplitude of displacements in the horizontal components is usually several times lower than in the vertical component
Surface waves attenuation analysis
Field seismogram of surface waves (lower pool of the Plavinas HPP dam)
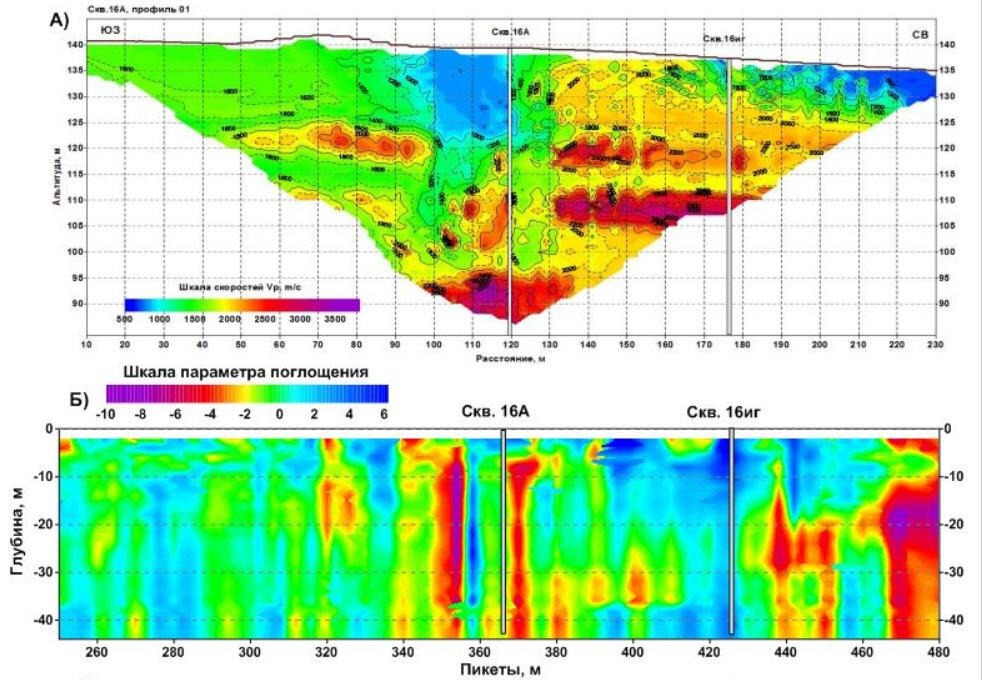
Multi-position analysis of surface wave energy attenuation
In traditional methods of shallow-depth engineering seismic exploration, when elastic oscillations are excited by shock surface sources or explosions of superimposed and low-level charges, the vast majority of energy is spent on the generation of low-frequency low-speed surface waves. During the propagation of these waves in the subsurface soil with varying physical properties the reflections occur from local inhomogeneities, so that at records local anomalies of high energy surface waves can appear due to the convergence effect.Such anomalies may be as indicative sign of hard reflective surfaces, in particular vertical zones of fracture and discontinuity of the soil mass and the bedrock. The method of surface waves energy analyzing is based on determining the frequency-dependent absorption coefficient, which, in turn, allows to estimate the attenuation of different harmonics and frequency components of their spectra at different depths of oscillation penetration into the soil thickness depending on the wavelength.
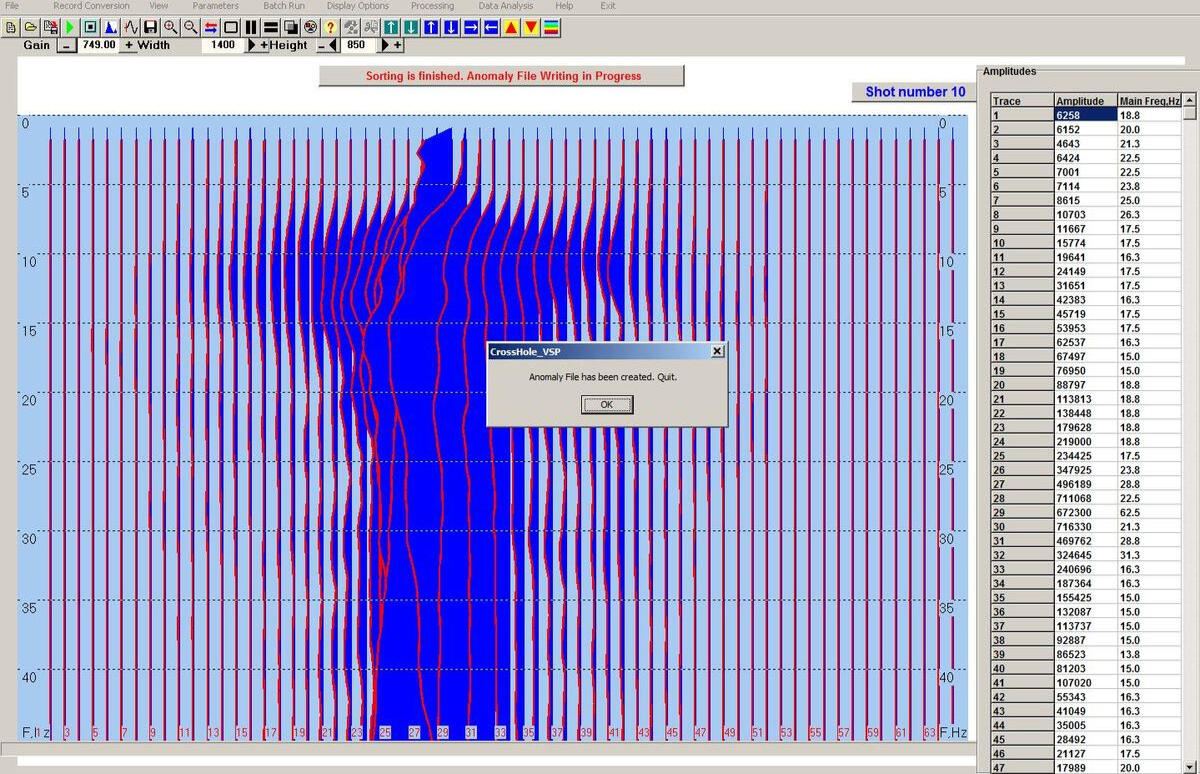
Working window of the program of trace-to-trace relationship calculation of surface wave spectra
The parameter of attenuation of the surface wave energy is calculated according to the relationship of the spectral components in pairs of seismic record traces equidistant from a common central point (midpoint) on the profile. When the relationship calculating an attenuation of wave energy due to the wave front geometric spreading in according to the law of inverse square root of the distance between the traces takes into account. With a high multiplicity of overlapping observations, the number of tracks belonging to each midpoint of the records from different sources is large, thereby a powerful statistical effect is achieving that minimizes, in general, the fluctuations of spectra due to differences in surface conditions of geophone installation.
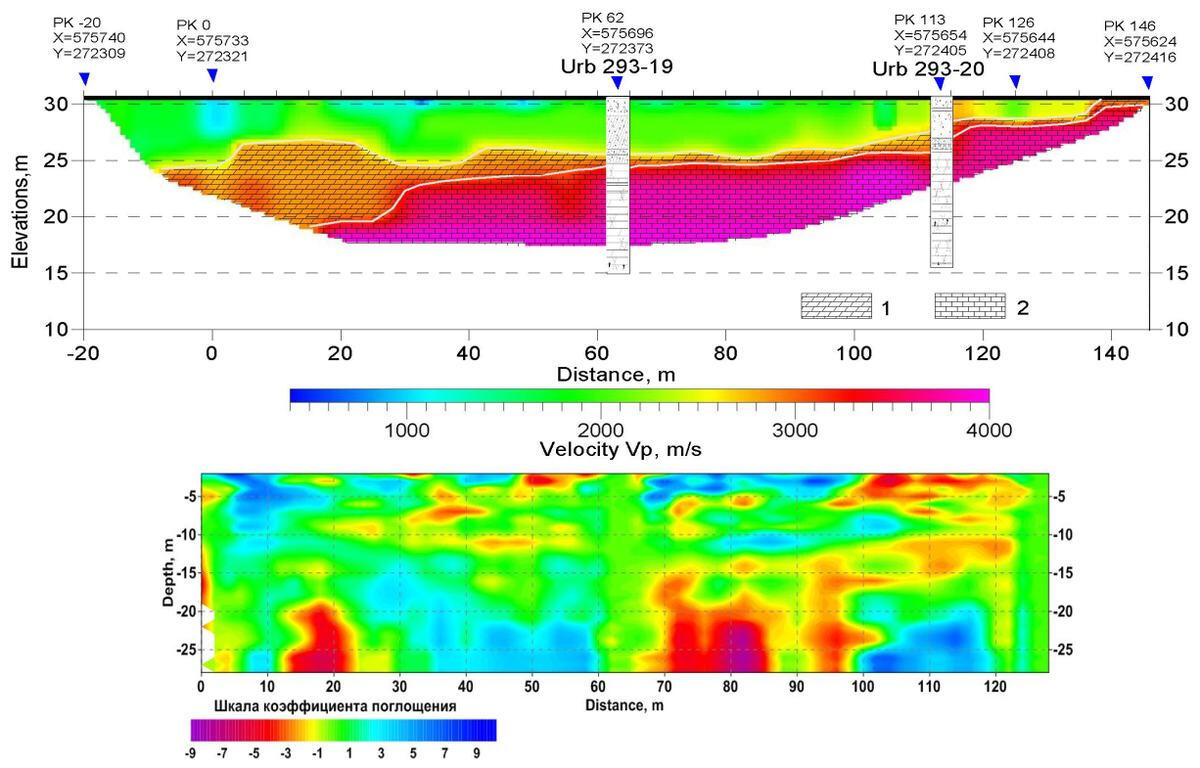
The section of the longitudinal wave velocities and of surface waves energy dissipation on the profile downstream the Plavinas HPP dam
The result of the calculation is a two-dimensional convolution (quasi-section) of the surface wave energy absorption coefficient array along the depth and distance. The depth to which the calculated value of the absorption coefficient relates is determined by the depth of energy maximum of corresponding frequency component, which, in turn, depends on its phase velocity. Therefore, joint interpretation of multichannel analysis of surface waves (MASW) and calculation of frequency-dependent absorption coefficient is most effective. The relationship of the absorption coefficient with P-wave velocities is less significant, but you can see some high-quality matching characteristics of the investigated section, based on two independent methods.
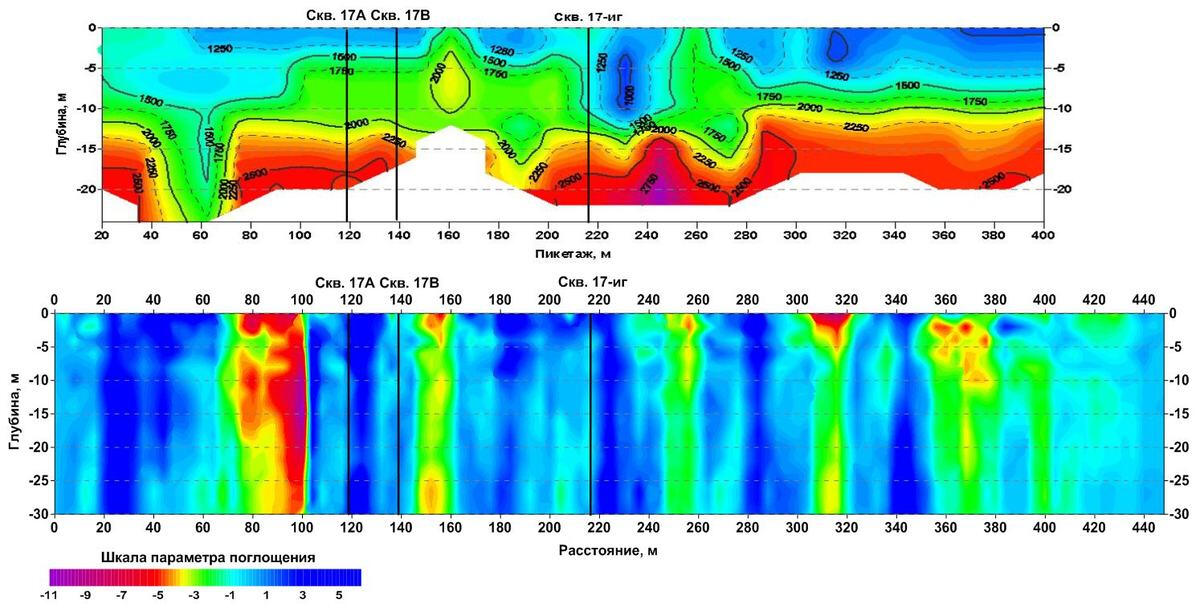
Section of longitudinal wave velocities and attenuation of surface wave energy at the site of a local earth’s surface subsidence on the mine field over underground salt mines
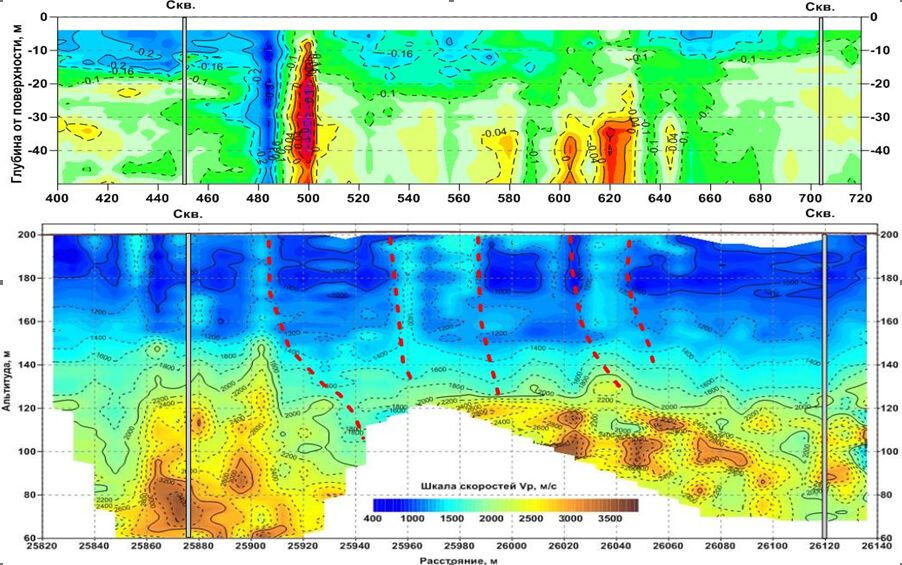
Following results of calculation of longitudinal wave velocity sections and energy of surface wave dissipation based on the materials submitted by the division of active seismoacoustic of Mining Institute of UB RAS (Perm).The positive values of the absorption coefficient (blue) correspond to the areas with low longitudinal wave velocities at the earth’s surface subsidence sites. The anomalous areas with negative values of the absorption coefficient (red colors) correspond to places where the "feeding" of surface wave energy takes place due to reflection and scattering at the potential boundaries of zones in the rock massif with vertical fracturing and crushing.
Longitudinal wave velocities sections according to inverted VSP and attenuation of surface wave energy data
On these sections zones of surface wave energy increasing due to reflection on possible sites of vertical fracture and crushing of rock massif on borders of the low-velocity zone of the earth’s surface accelerated subsidence on the mine field over the abandoned salt developments are shown.
Multi-electrode electrical soundings (electrotomography)
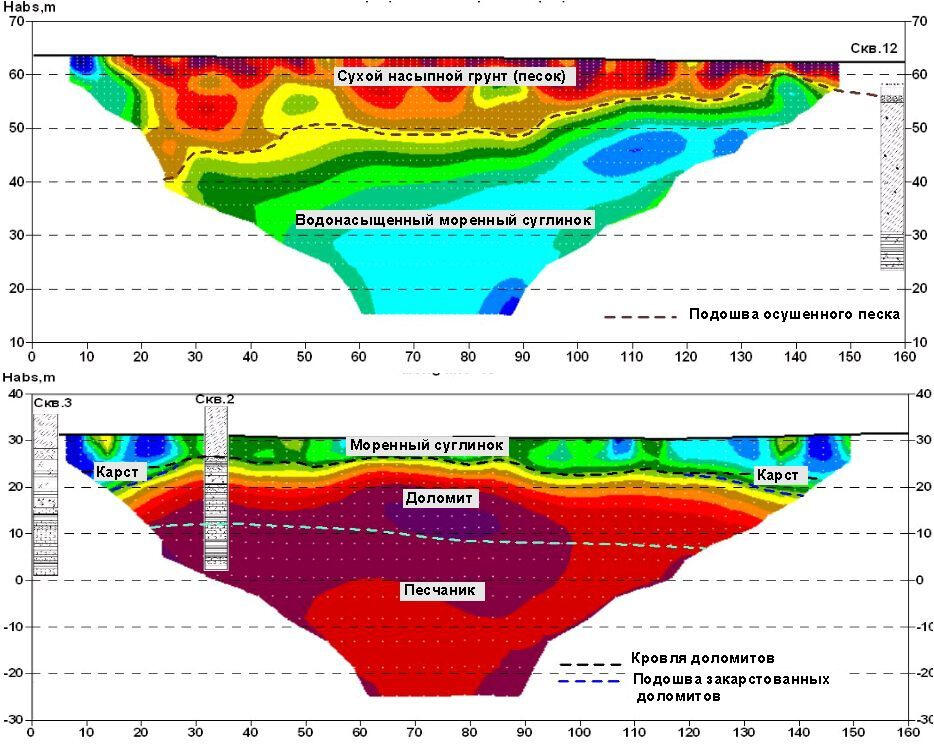
Geoelectric sections of bulk and moraine soils in the band of the design reserve spillway of the hydroelectric power plant dam
At the top – a section with a high-resistance layer of dry bulk sand near the HPP substation covering a thickness of water-saturated moraine loams in the middle part of the projected spillway. Below - a section with a layer of moist alluvial sand and moraine loam, lying on the bedrock dolomites on the site of the projected water dropping sump of reserved spillway in the lower pool of the dam. The manifestations of active and buried karst are outlined in this area, which can be seen in the section of apparent resistances in the form of its lower values, as well as in the sections of P-wave Vp and S-wave velocities according to the seismic survey performed here. During the drilling of geotechnical boreholes the presence of weathered dolomite and dolomite near the border of the moraine and the bedrock surface were revealed.
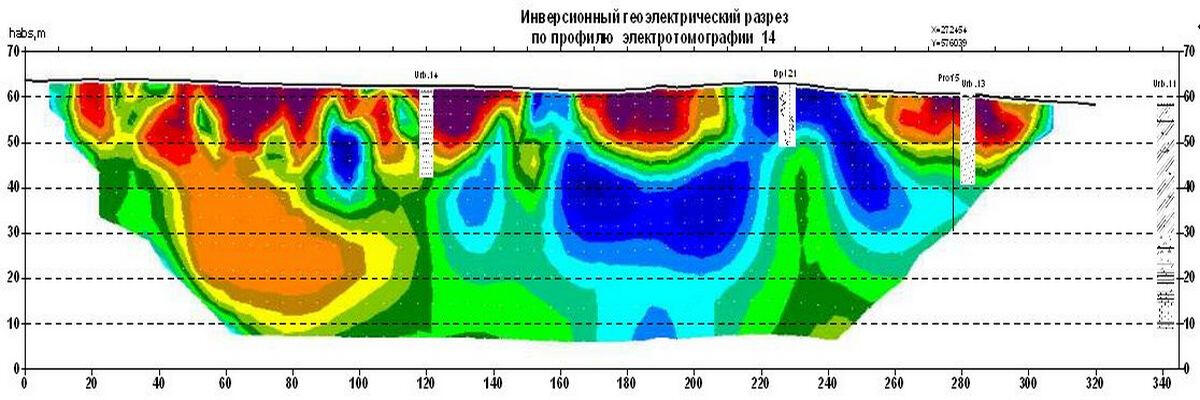
Geoelectric section of moraine soils along the axis of the emergency spillway
A geoelectric section along the bottom of a deep glacial valley filled with moraine loams and large-block fluvial deposits along the profile.In the section, by the areas of reduced resistances display the places of the water-saturated moraine loam exit to the earth’s surface. High resistances are characterized the areas with a high content of coarse - grained material - pebbles, rubble, boulders, which is confirmed by the data of cone penetration (CPT) and standard penetration (SPT) tests and drilling. In the initial part of the profile at a depth of more than 20 m, in all probability, the accumulation of large blocks of fluvioglacial material in the edge part of the buried valley is displayed.
Geological problems and solutions
Localization of remains of old building structures in soils
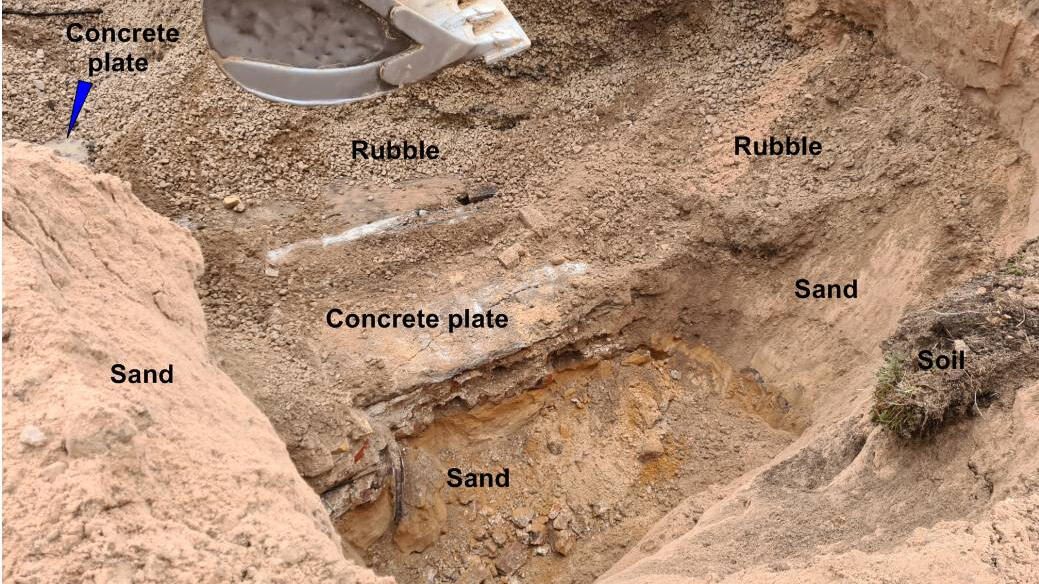
Confirmation of an object identified in the soil as a result of subsequent opening
When performing construction work, the task of localizing the remains of the foundations of previous structures in the soil often arises. This task is especially relevant when designing pile foundations without preparing the corresponding pits at the construction site. Often, when demolishing old buildings, it is not possible to completely remove the most deeply buried massive parts of the old foundations. These mostly concrete remains have very contrasting physical properties to the surrounding soils. Their surfaces represent boundaries at which sharp changes in acoustic and electromagnetic impedance occur, which makes it possible to map them using seismoacoustic and georadar sounding methods.
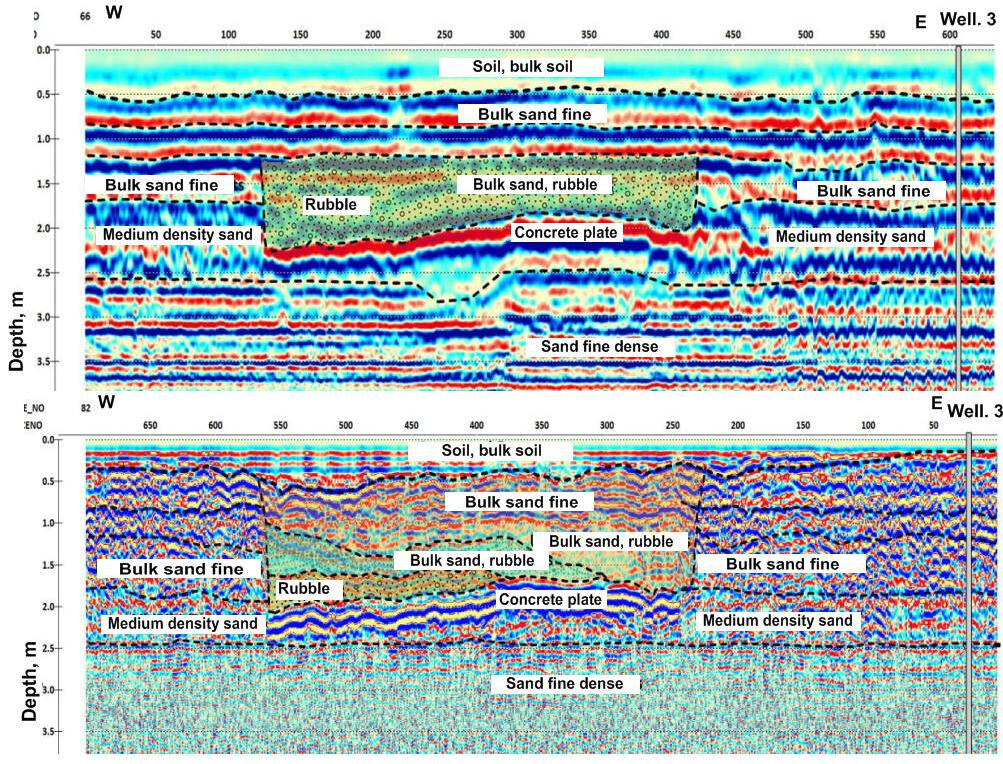
An example of localization of the remains of an old foundation at the construction site of a sports facility.
The most widely used method for localizing foreign objects in soil massifs is georadar sensing. It is the simplest in terms of field work technology and allows you to quickly survey fairly large areas. Data processing is also quite simple, but requires much more time. The simplicity of field technology makes it possible to work out a fairly dense network of profiles at the survey site, which makes it possible to subsequently move from two-dimensional sections along profiles to a three-dimensional display of the soil mass under study.A network of georadar profiles was developed at the site using receiver-emitting antennas of various types with probing pulse frequencies of 75 MHz, 150 MHz and 900 MHz. The figure below shows examples of displaying the remains of an old foundation at a depth of 1.9-2.3 m on GPR sections obtained at different frequencies of the probing pulse.
Surveys for the construction of hydrotechnical structures
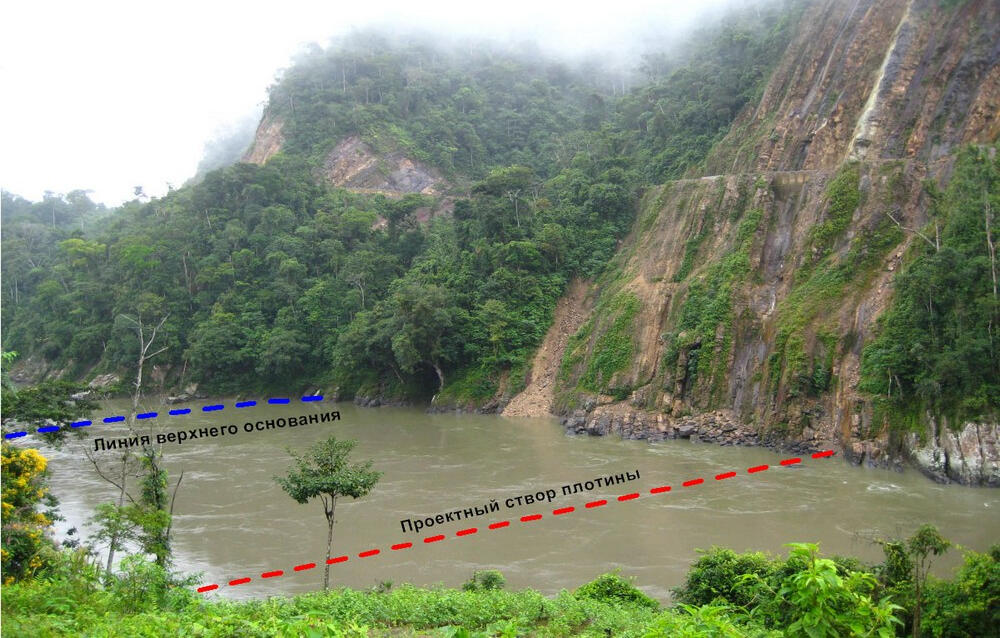
The stem of a mountain dam at the Inambari river (Peru)
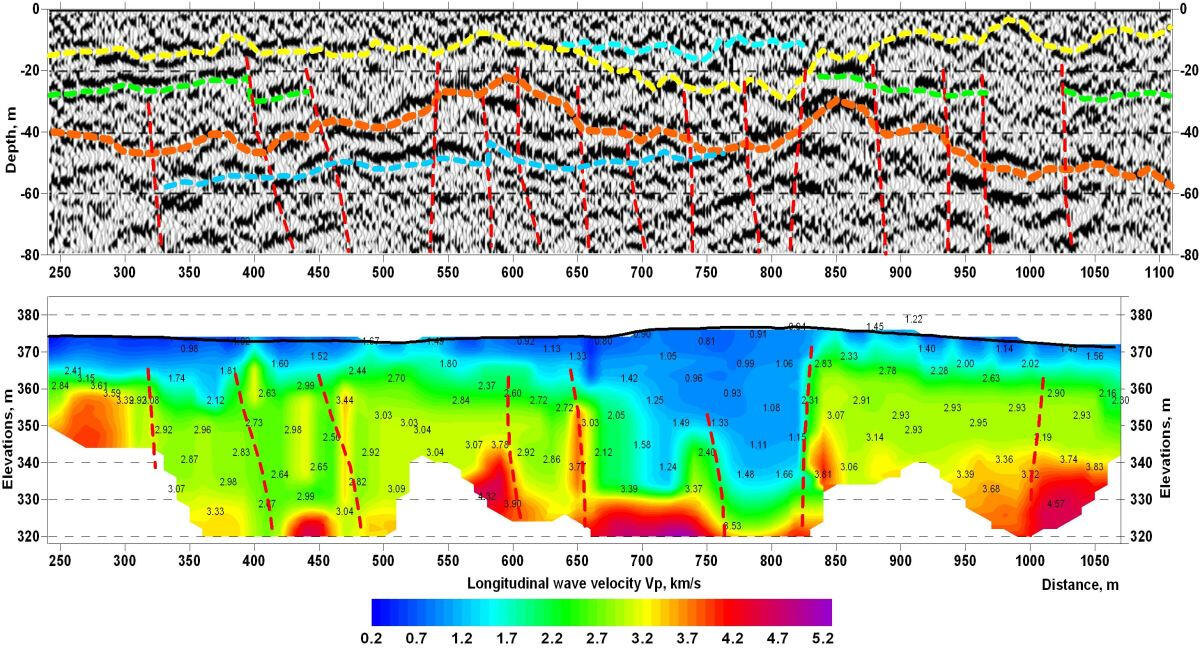
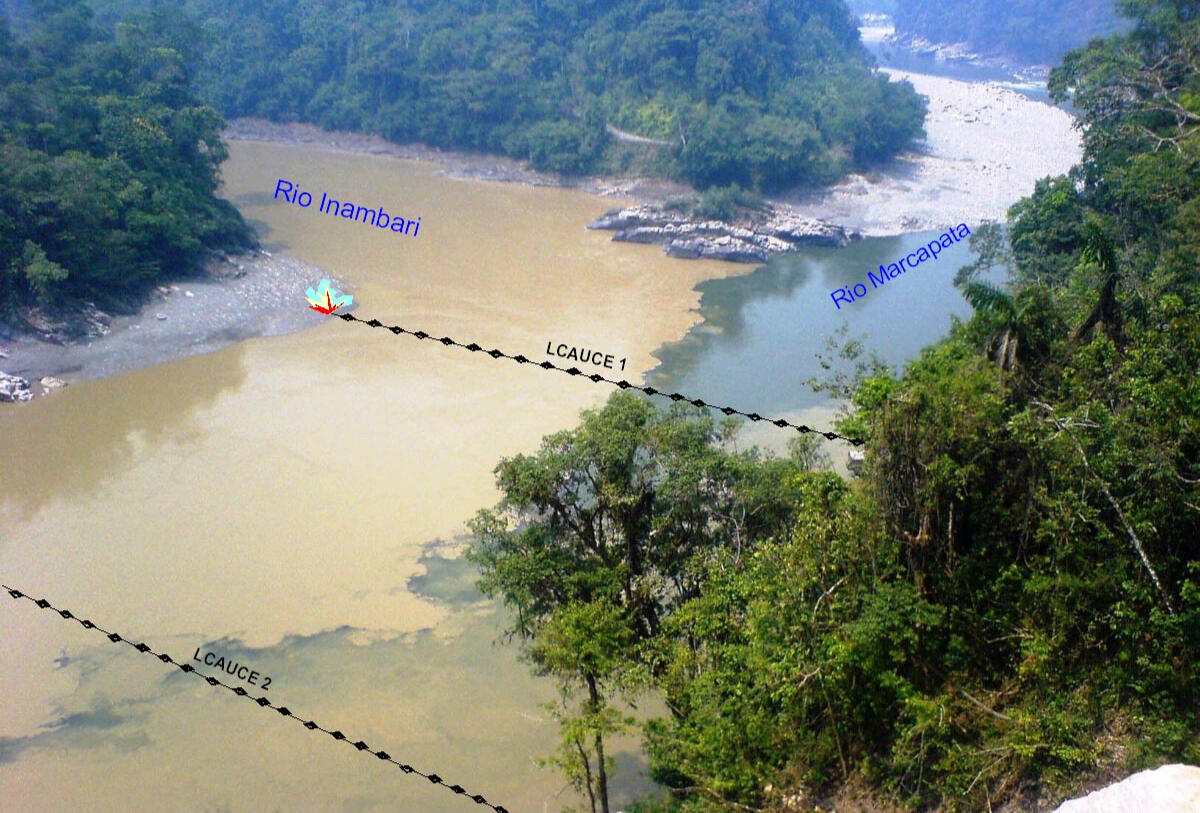
CDP and velocities Vp sections through the dam at the Inambari river (Peru)
The study of soil massifs and rock bases in the study of large industrial hydrotechnical objects is performed using the most complete set of methods of multi-wave engineering seismic exploration: by reflected, refracted and surface waves. The figure shows CDP section, which displays the surface profile of the bedrock base, and the section of the longitudinal wave velocities, characterizing the properties of the weathering crust array along the profile along the projected dam on the Inambari river (Peru). A wide zone of low velocities corresponding to the exit to the surface of the layer of weathered destroyed argillites among metamorphised quartz sandstones is traced.
Multi-wave seismic exploration in combination with electrotomography, drilling and penetration testing
The velocity sections of longitudinal (above), transverse (in the middle) waves and geoelectric section (below) characterizing water saturation of soils, together with the data of geotechnical drilling, static (CPT) and standard (SPT) penetration tests are used to assess the stability of the channel walls of emergency spillway and to determine category of soils during its excavation. Plavinas HPP on Daugava river.
Conditions of the soil embankment and bank protection
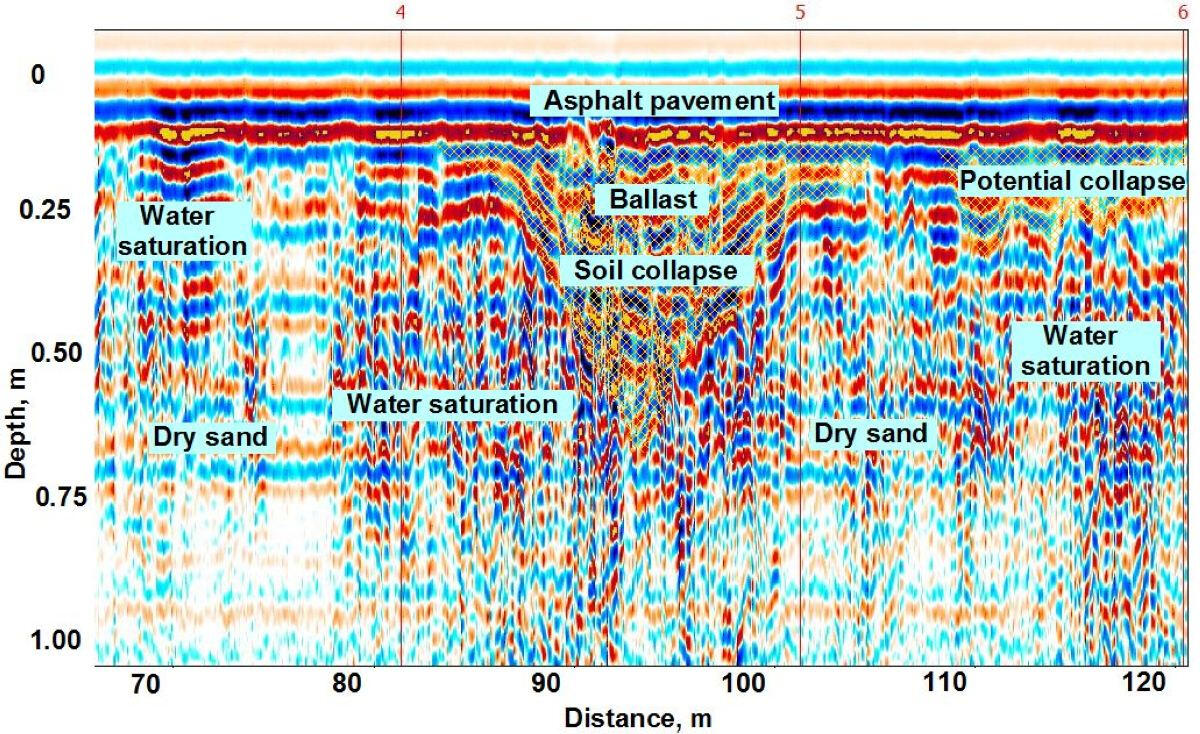
GPR section of ballast dumping on the site of the embankment collapse
Identification of places of possible subsidence of hard cover of the embankment of the passenger berth of the seaport of Riga. The georadar sectiomb obtained with a shielded high-frequency antenna (900 MHz) displays a section of the soil foundation of the embankment at the point of manifestation of intense suffosion processes with the removal of thin fractions of sand into the river.
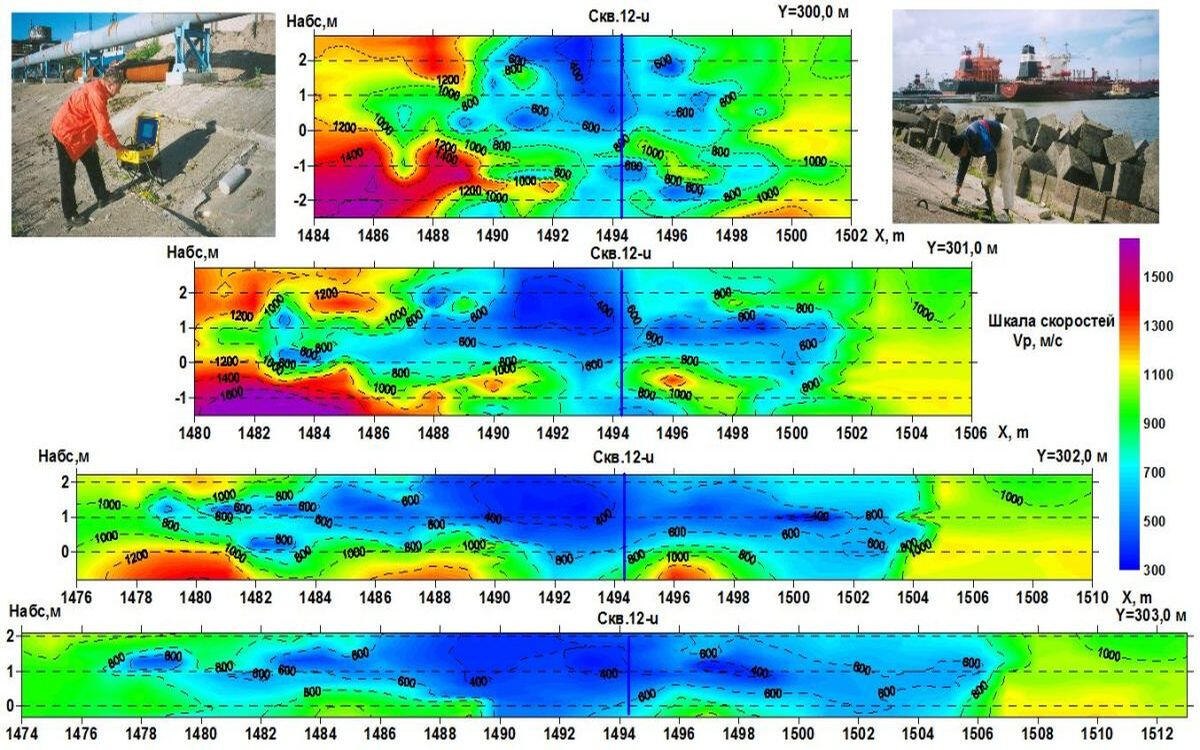
Research and monitoring of the condition of the soil mass of the bank protection of the oil terminal
In areas of the greatest subsidence of concrete slabs at the upper edge of the bank protection, wells with a depth of 8-10 m were drilled. To assess the spatial distribution of velocity heterogeneities of the soil mass, acoustic scanning was performed with the excitation of vibrations in the holes on the slope of the bank protection and reception in wells lined with polyethylene pipes.The distances from the borehole axis to the holes at the points of vibration excitation varied from 6 to 40 m. Thus, for each of the boreholes it was possible to carry out scanning in a section of the coastal slope up to 60-70 m.Vertical velocity sections were obtained along vertical planes running parallel to the axis of the oil distribution pipeline overpass. The planes of vertical sections are located at intervals of 1 m. The axis of the oil pipeline supports corresponds to a section along a plane passing along the ordinate 301.0 m. For each polygon, sections were obtained for planes with ordinates 299, 300, 301 and 302 m. Due to the characteristics of the propagation paths and spatial location the refraction points of seismic rays, sections on different planes have different limitations in depth and in the X coordinate. A series of sections clearly shows a low-velocity anomalous zone to a depth of over 3-4 m, expanding towards the sea.
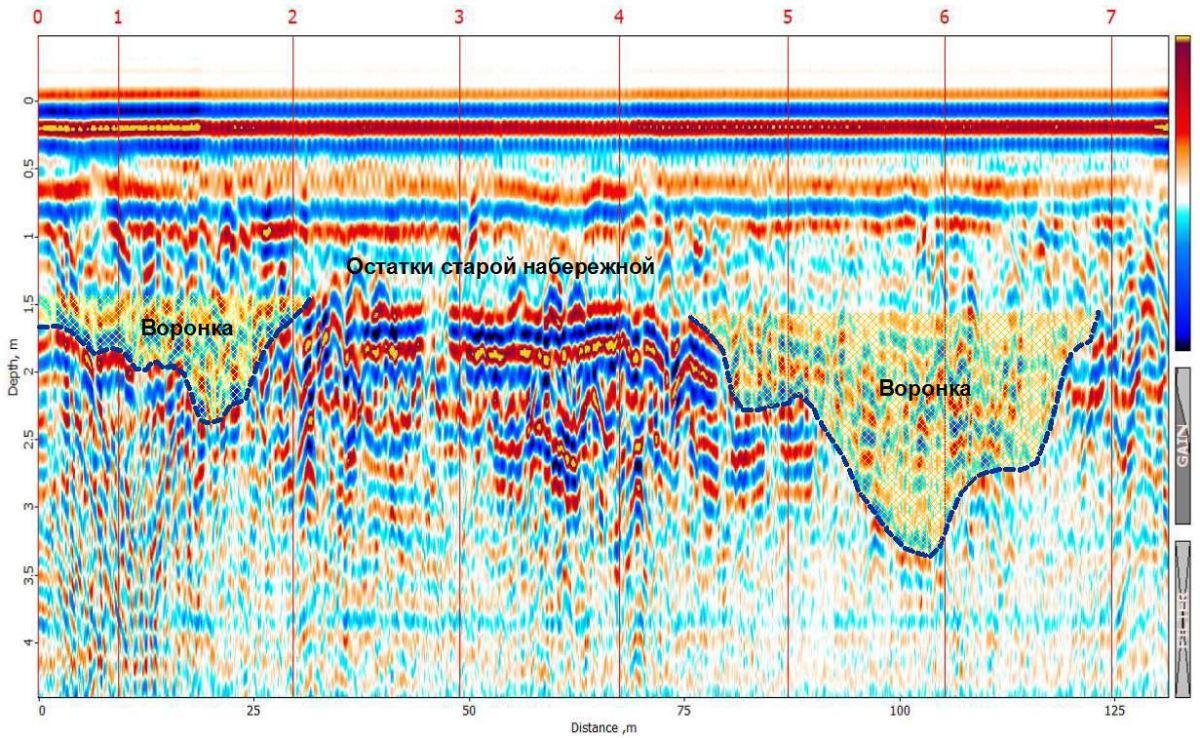
Study of the structure of the quays soil foundations
Example of detection of air bombs craters on the surface of the old embankment of the passenger port of Riga, destroyed during the Second World War.The structure of the bulk soil array and the foundation of the old embankment is displayed on a georadar section obtained from a low-frequency dipole antenna (150 MHz).
Identification of areas of water filtration from reservoirs
.
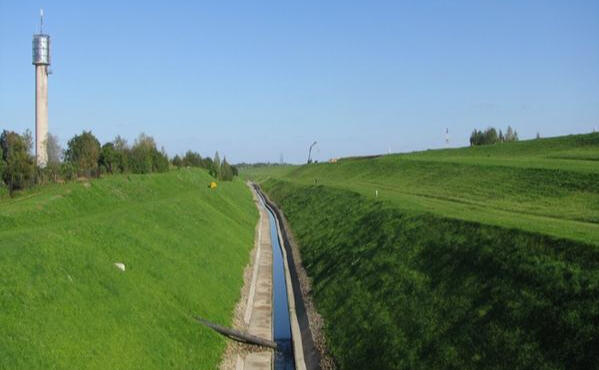
Filtration of water from reservoirs under the action of increased static pressure of water masses is normal process and in stationary mode and the presence of drainage channels does not threaten the safety of dams. The danger of dam destruction in high floods occurs in places of high filtration speed and the encouragement of bulk soils.
Detection of zones of increased water content in the body of dams by GPR
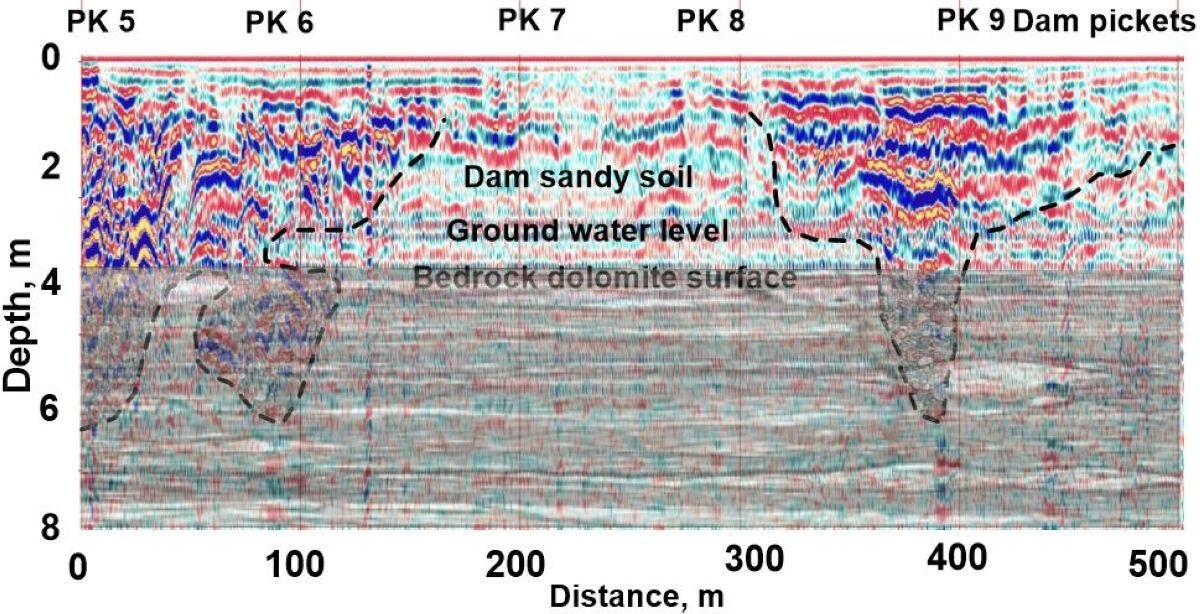
Distribution of palaeokarst in the river valleys , cutting through the bedrock of sulfate-carbonate composition, and accelerated the karst processes along the shores of artificial reservoirs contribute to the emergence of channels of water filtration through the dam and foundations of dams. The accelertaion of filtration processes captures bulk soils of protective dams, which increases the likelihood of erosion and destruction in the event of extreme floods.On the GPR sections the zone of increased saturation and filtration in the dam body and foundation are displayed by increased amplitudes of reflected signals
Refracted wave seismic method of detection of possible filtration zones
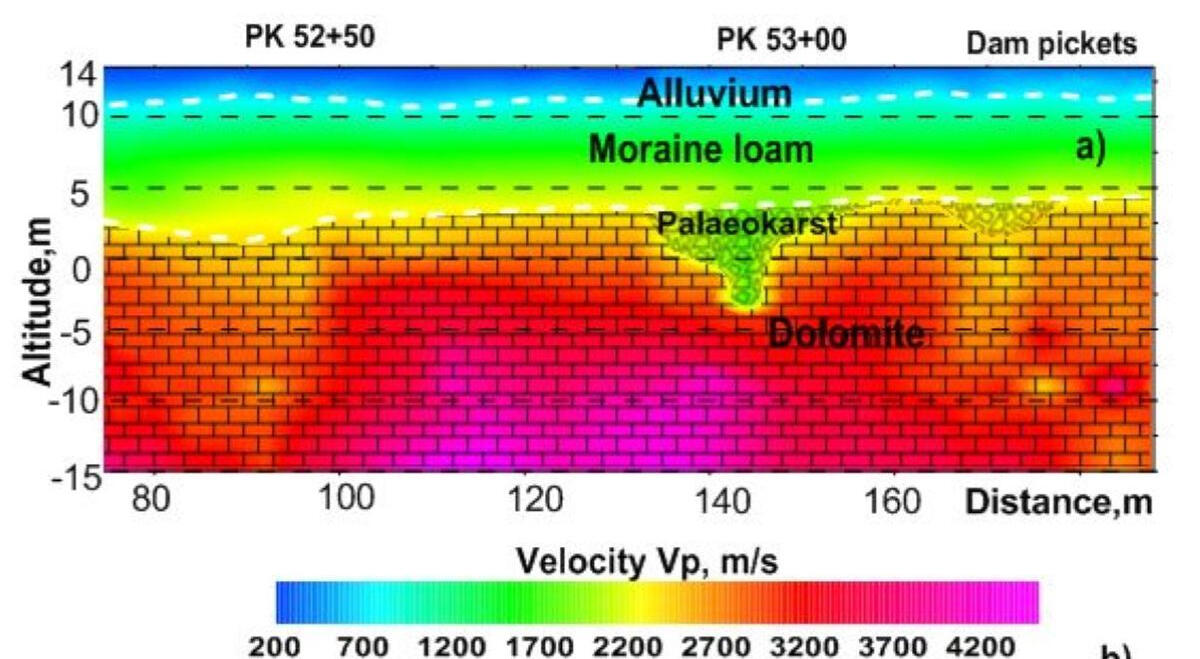
Seismic methods of detection and localization of filtration channels are usually used in cases where it is necessary to assess the depth of their penetration into the thickness of the rocks at the foundation of the dam, since the depth of the GPR method is often limited by the surface of full water saturation.The method of refracted waves allows to characterize in detail the structure of the weathered surface of halogen-carbonate rocks and to determine the areas of evolution of palaeocarst cavities to which the channels of water filtration from the reservoir are usually confined.
Reflected wave seismic method of possible filtration zones detection
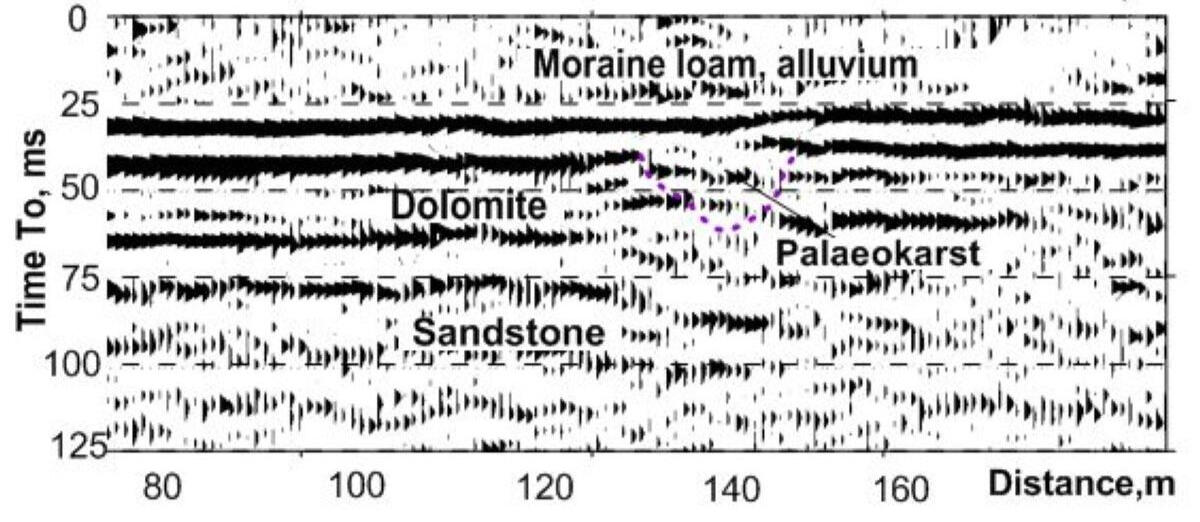
Seismic method of reflected waves in modification of SDP (Gommon depth point) with multiple accumulation of signals reflected from one section of the boundary, allows to map not only the surface of the bedrocks, but also reflecting boundaries in their thickness.The CDP method is more time-consuming and expensive compared to the method of refracted waves, requires more complex data processing. But at the same time it allows to identify the manifestations of palaeokarst and, accordingly, potential channels of filtration at considerably greater depths up to several tens of meters.
Buried glacial and river palaeovalleys mapping
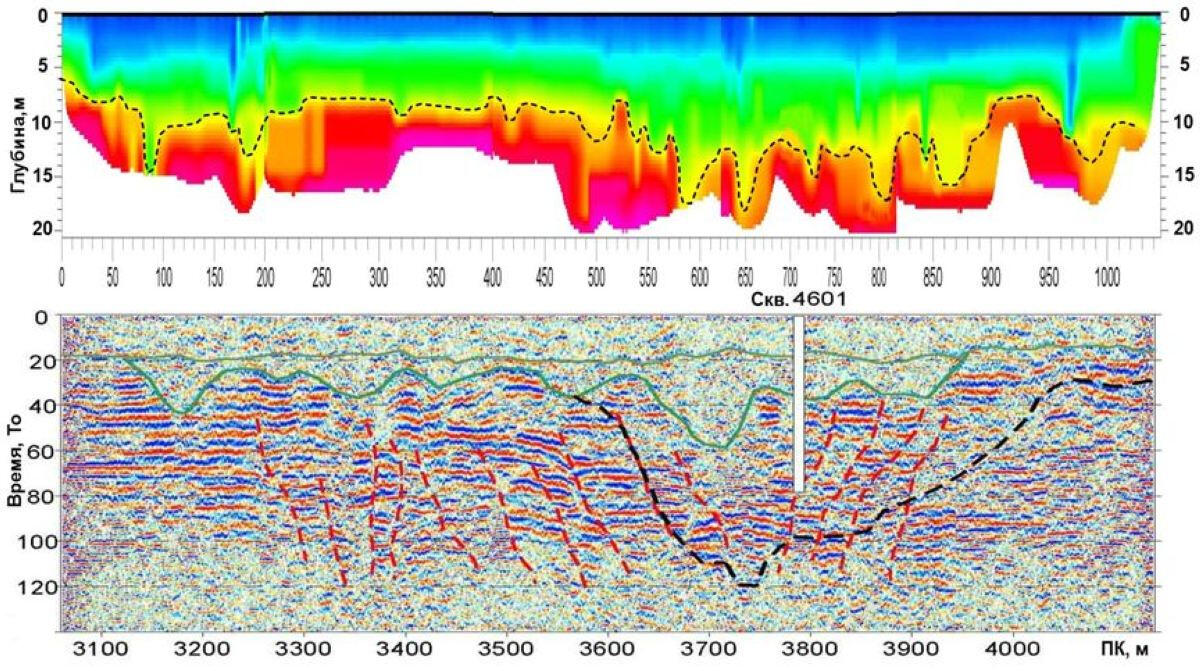
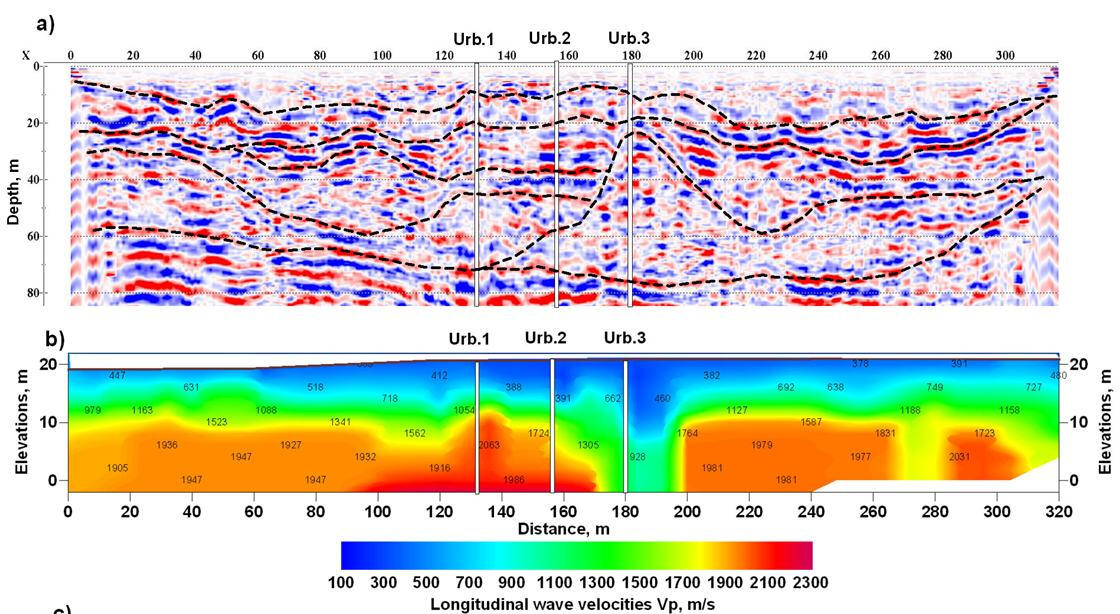
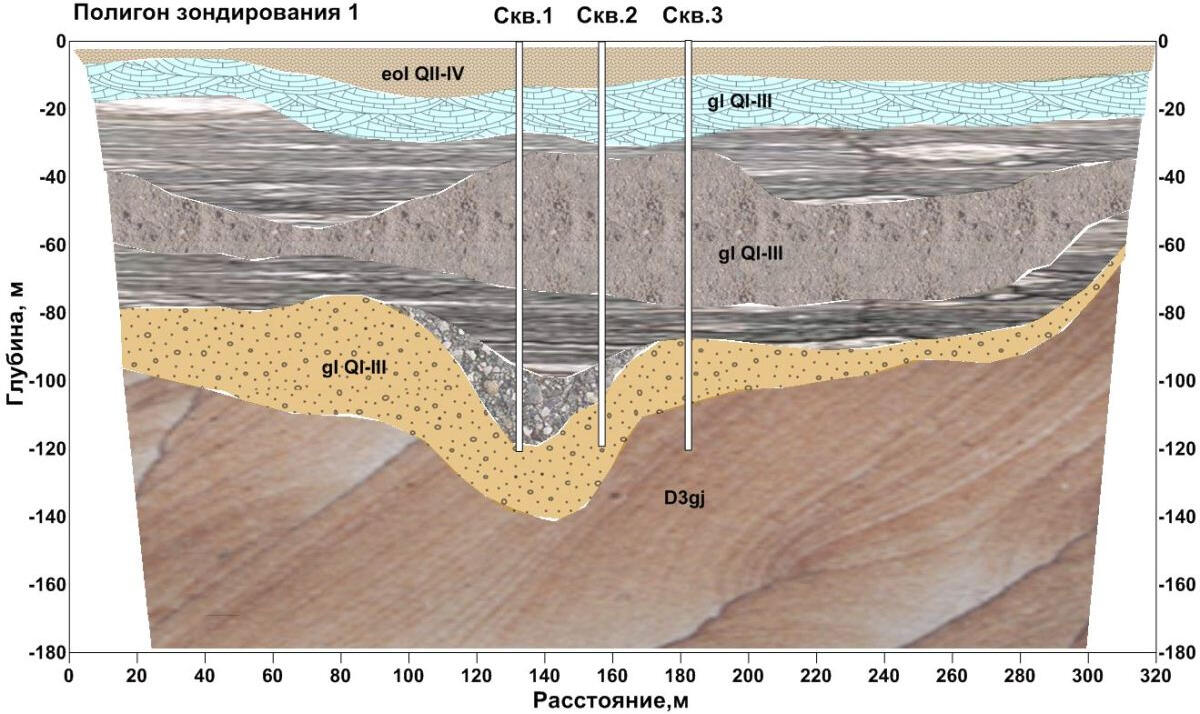
Left bank dam of the reservoir of Pļavinas HPP
Ledges of the buried preglacial palaeovalleys usually are characterized by a block structure, the presence of sub-vertical planes of sliding and the extensive development of karst. With the change of the hydrodynamic conditions after filling the reservoirs at these sites the rate of filtration of underground waters increases, processes in caves activate. In connection with this relevance of geophysical monitoring of the condition of protective dikes and dams in places their crossing with palaeovalleys increase.
Example of the seismic time section of ОГТ, obtained by the method of reflected waves, and the section of the speed of propagation of longitudinal waves according to the method of refracted waves in the interval of marine sediments filling the buried preglacial valley (Vangazhi, Latvia).
Preglacial valley section at the site of the project water intake in settlement Vangazi
Coarse-grained moraine deposits filling the deepest parts of palaeovalley, are characterized by increased permeability and groundwater filtration rate. They are of interest as highly variable sources of water supply. Shallow seismic by reflection wave technique together with reference drilling data provides a picture of the structure of the moraine sediments filling palaeovalley, and allows to optimize assignment the points of water intake wells in places with the greatest thickness of coarse-grained sediments loops.
Study on the erosion of concrete dam blocks
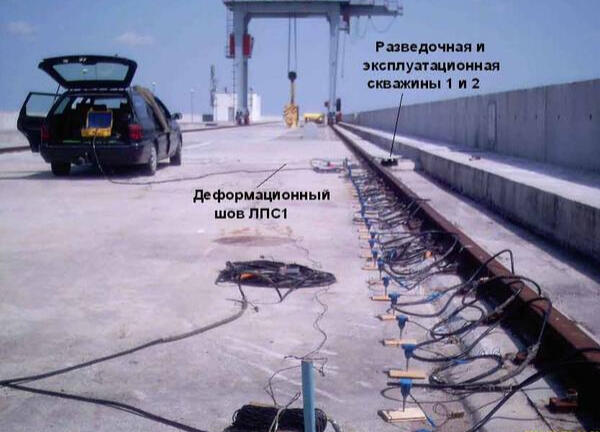
.
Parts of the concrete blocks and walls, located close to the frequently changing level of water in temperature seams in sites of their waterproofing violation are most affected by the erosion.
.
Crosshole acoustic
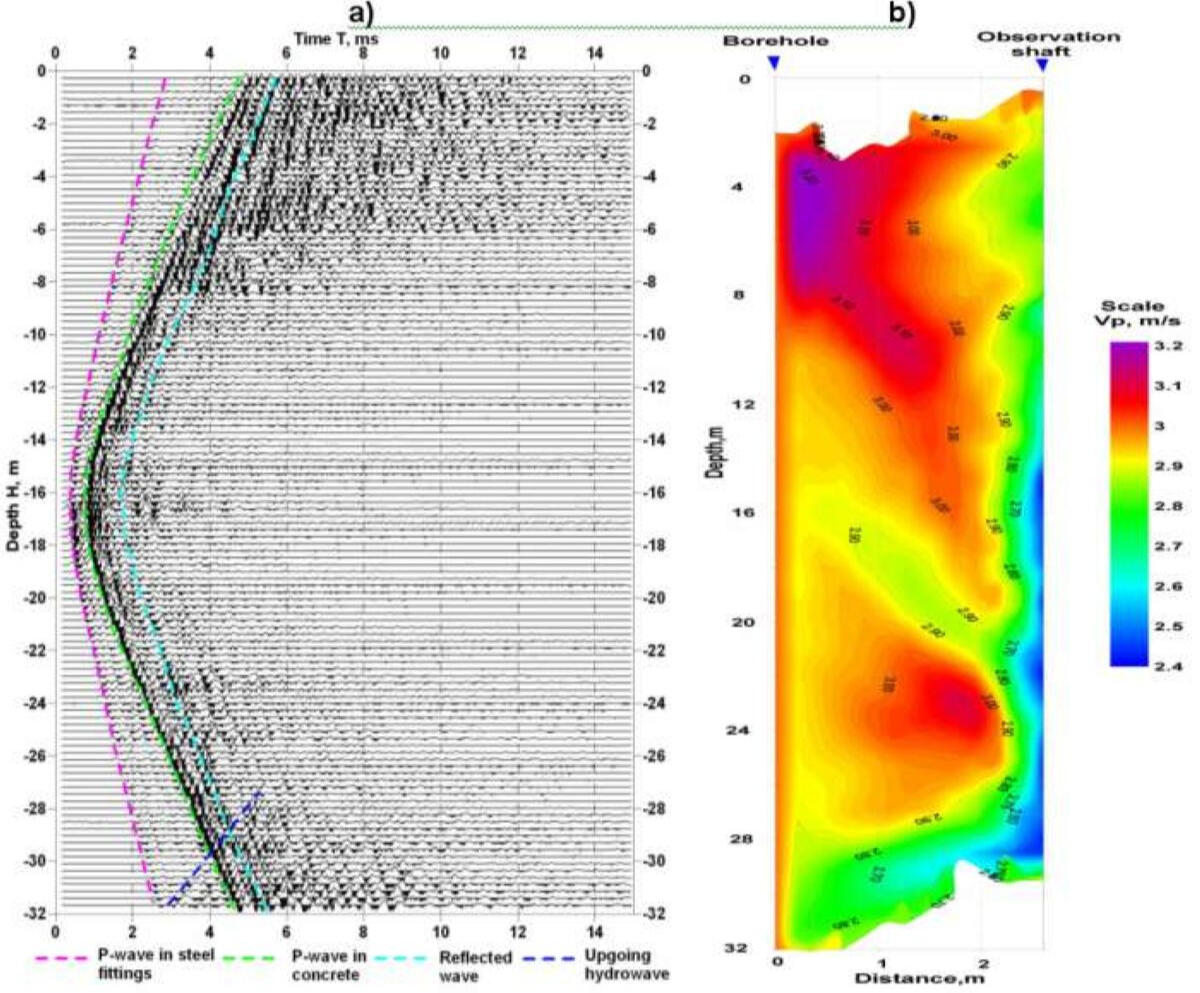
The most effective way of identifying areas of massive block of concrete erosion and deterioration of its strength properties is crosshole scanning. To perform this kind of research, it is necessary to prepare at least two wells to accommodate the sources and receivers of acoustic pulses.The figure shows an example of weak zones detection in the wall of the Kruonis PSP dam block as elastic wave velocity propagation decreasing.
.
Non-longitudinal vertical profiling in wells
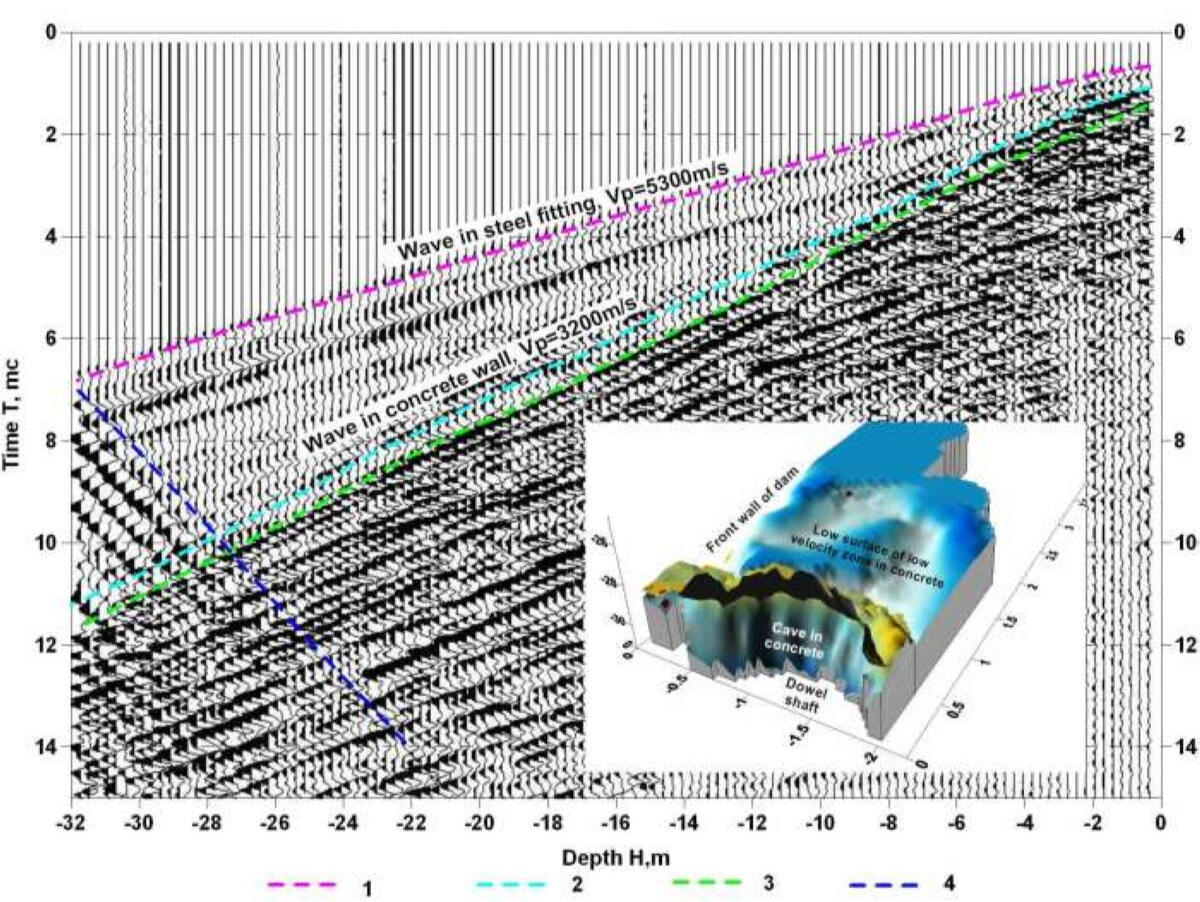
If there is only one well, studies can be performed using the method of vertical seismic – acoustic profiling with the location of elastic wave sources along non-longitudinal profiles on the surface of the concrete block, and receivers - in the well.Despite certain limitations, by such technique is possible to identify the spatial position of the zones of decompaction in concrete, or to localize the possible cavities and cavities in places of aggressive leaching action of water.
Profiling at the top of the dam on reflected waves
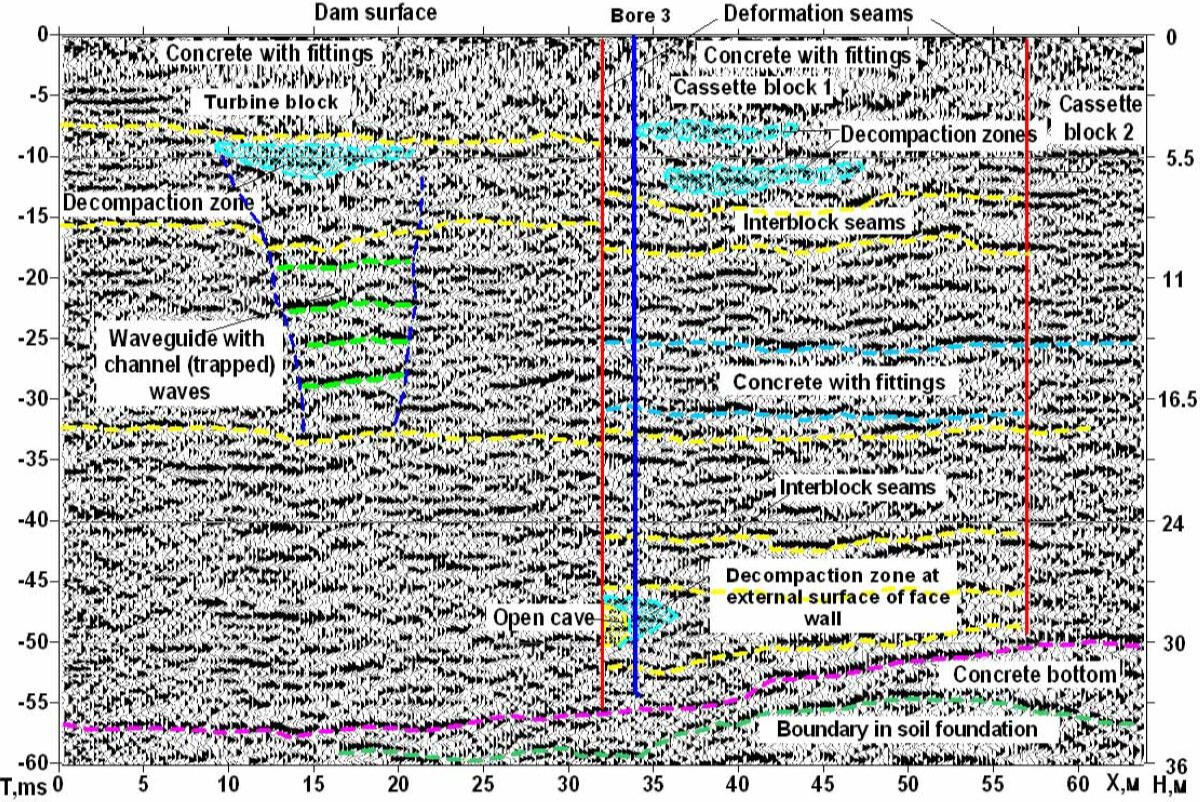
The easiest and most accessible way to study the properties of concrete in large blocks is to profile by reflected waves technique from the surface. Usually on the section layered concrete structure is manifested associated with the layer-by-layer filling and the presence of reinforcement. In some cases, according to the characteristic features of the wave pattern in the sections, it is possible to identify the presence of anomalous zones associated with the decompaction.Profiling by the method of refracted and surface waves on the surface and walls of concrete blocks can be used to detect inhomogeneities in the surface layer of concrete.
Karst processes in the riverbed
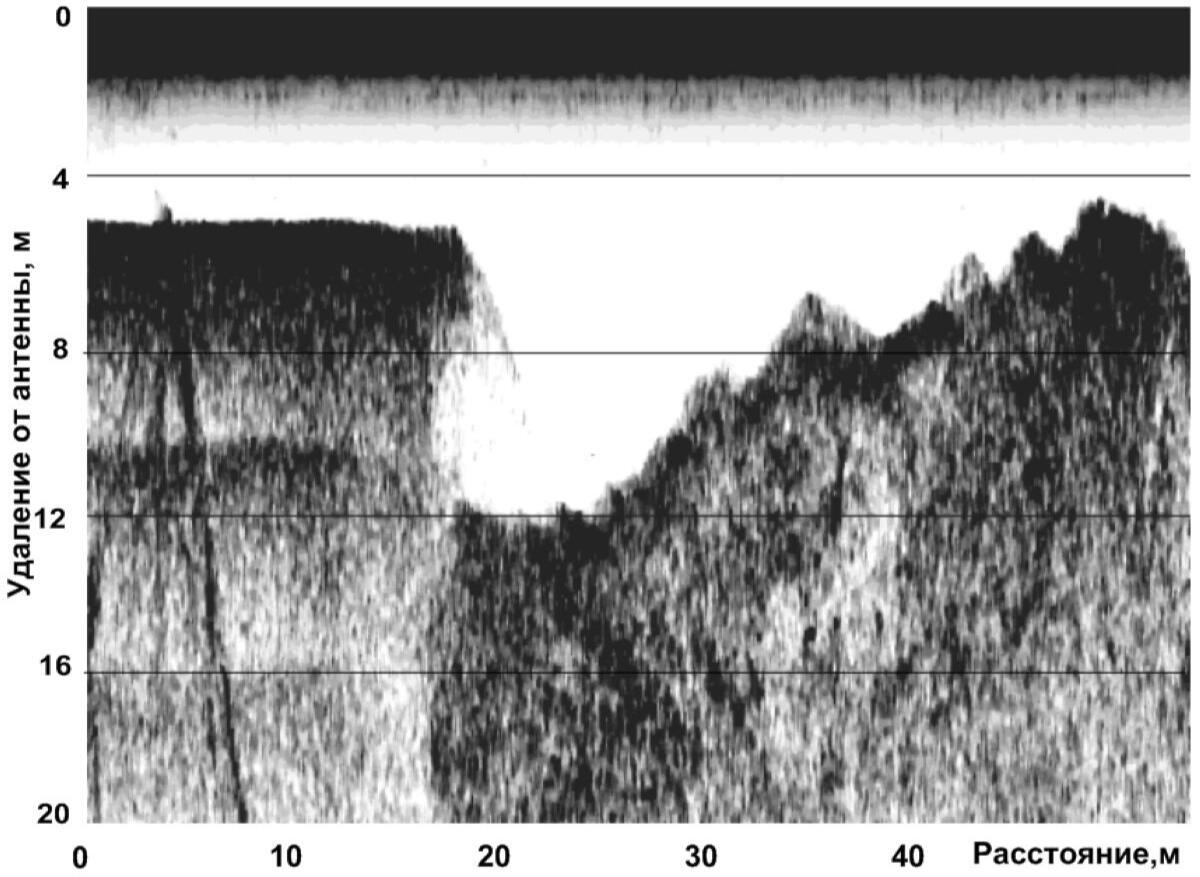
Mapping of the karst cavity at the bottom of the drainage channel on the side-scan sonogram
Buried karst in the foundation of dams of hydroelectric power stations and protective dams of reservoirs is a serious danger for these structures. Changing the regime of groundwater filtration near reservoirs, increasing static pressure due to a significant increase of water level and high flow rates in drainage channels activate the processes of karst formation and erosion of ancient karst cavities in the foundations of structures.At the bottom of water bodies manifestations of karst can be identified by the methods of echo-sounder measurement, side-scan sonar surveying and subbottom continuous profiling.
Subbottom profiling during mapping the underwater cavity
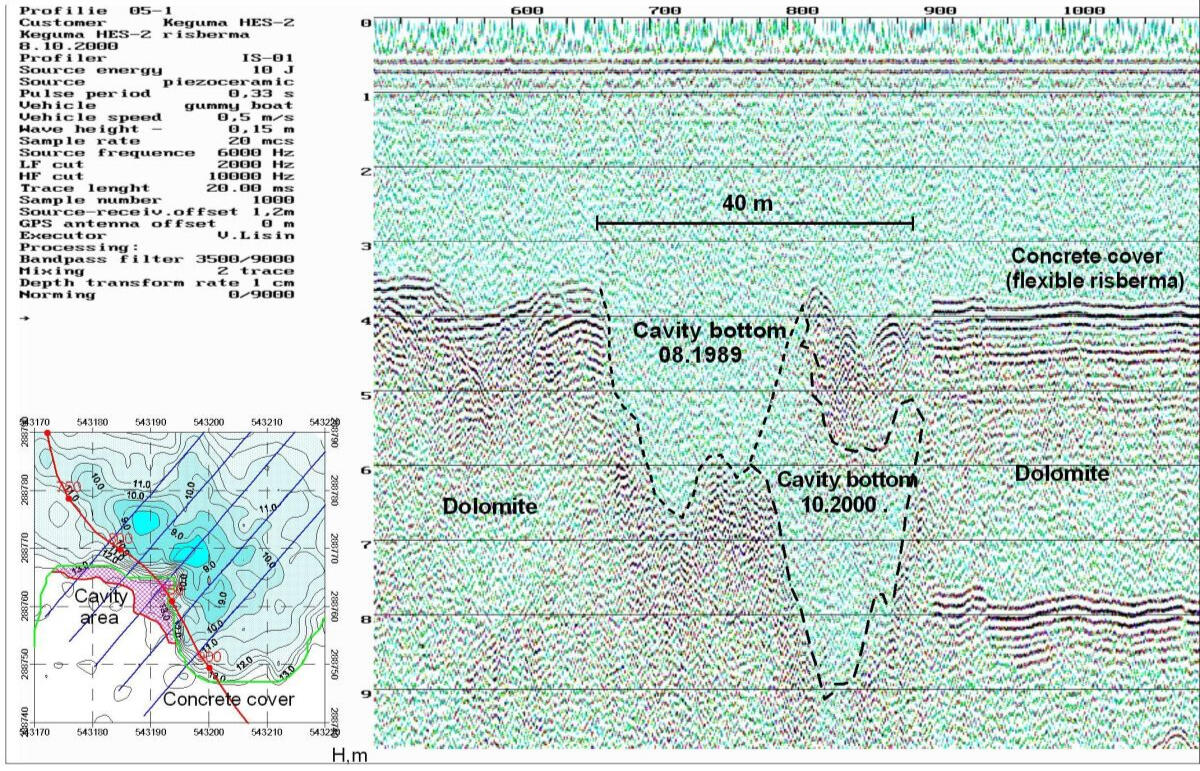
Seismoacoustic profiling with high-frequency transducers allows to identify the picture in the place of erosion palaeokarst cavity in the dolomites under a flexible apron of a drainage channel of a hydroelectric power plant.
The result of profiling on a dense network of profiles can be presented in the form of vertical sections, horizontal sections, or in the form of a 3-dimensional reconstruction of the cavity.On the vertical section along the profile overhanging the concrete slab of the destroyed edge of the flexible apron of a drainage channel Kegums HPP-2 on the Daugava river is visible.
Monitoring of the underwater caverns erosion
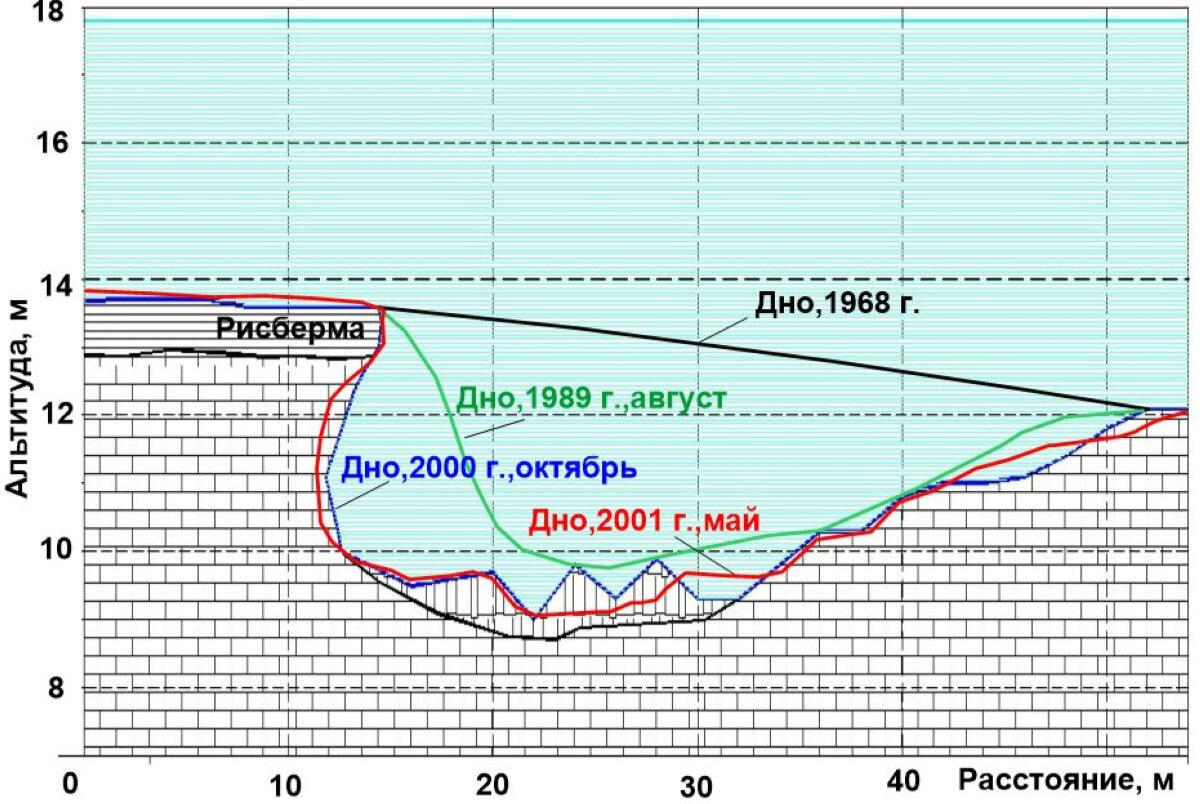
The results of repeated surveys by seismoacoustic profiling allow to trace the change in the profile of the underwater karst cavity, to estimate the speed of its erosion and the degree of danger to the hydraulic structure.The revealed cavity shape, its size, characteristics of its walls and bottom, as well as the distribution of the soil allowed to estimate the required amount and type of ballast to fill it, as well as to plan the optimal repair technology.
Definition of groundwater level
.
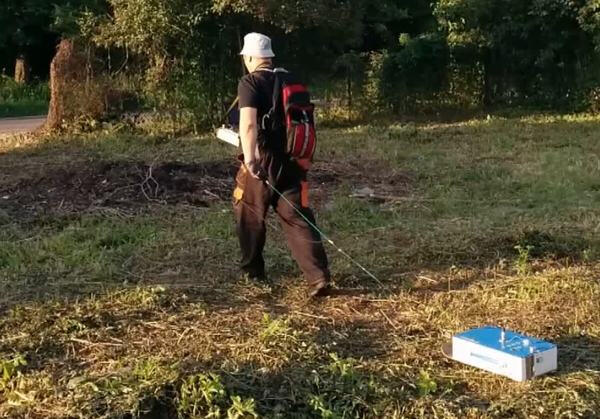
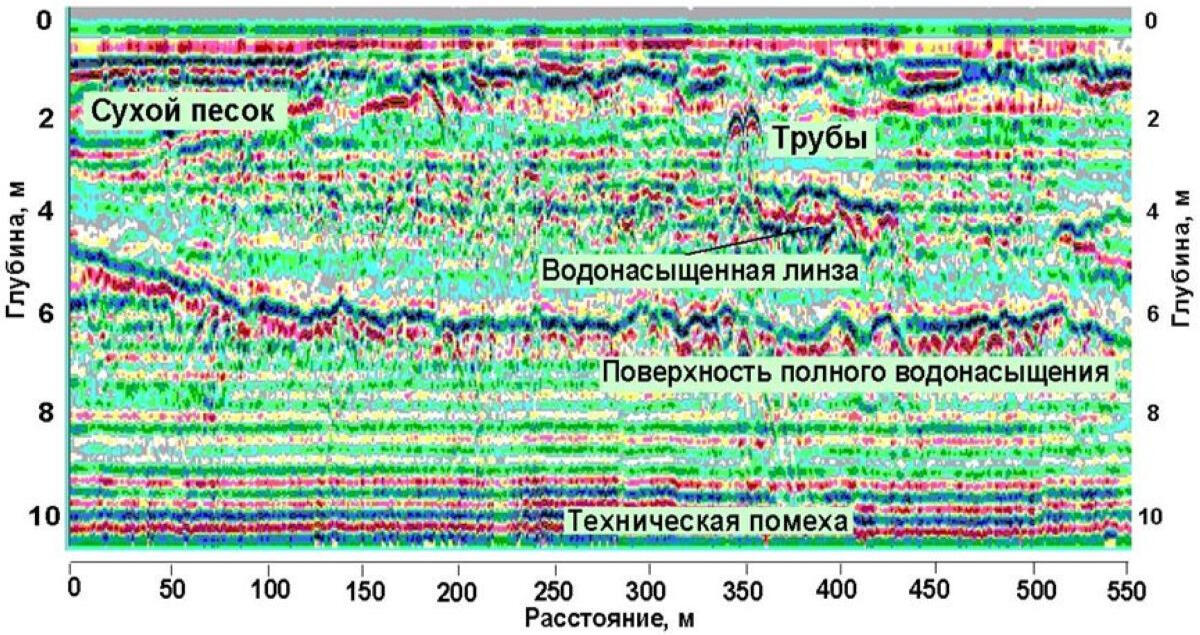
The surface of the total water saturation in the soil is a strong reflective boundary for high-frequency electromagnetic waves, so it is usually clearly displayed in GPR sections.
.
Mapping the surface of full water saturation by GPR
Depending on the type and operating frequency of the receiving antennas in sandy soils it is possible to trace the position of the groundwater level in the depth range of 1-15 m.The section also shows the areas of increased saturation in the lenticular and bedded lithological heterogeneities with higher porosity.
Assessment of water saturation of soil foundations of the piers
Suffosion processes in the soil foundations of port berths and quays, which occur under the influence of fluctuations in water level and the impact of the screws mooring ships, represent a real danger of failures and destruction of hard surfaces and subsequent costly repairs.On the GPR sections areas of increased water saturation in sandy soils are shown, the boundary between bulk soils of different composition, possible voids under the hard floors in areas of subsidence due to soil suffusion and removal of small sand fractions through the wall of the pier.The surface of full water saturation is often the last reflecting geological boundary on the GPR section.
Determination of groundwater level by seismic methods
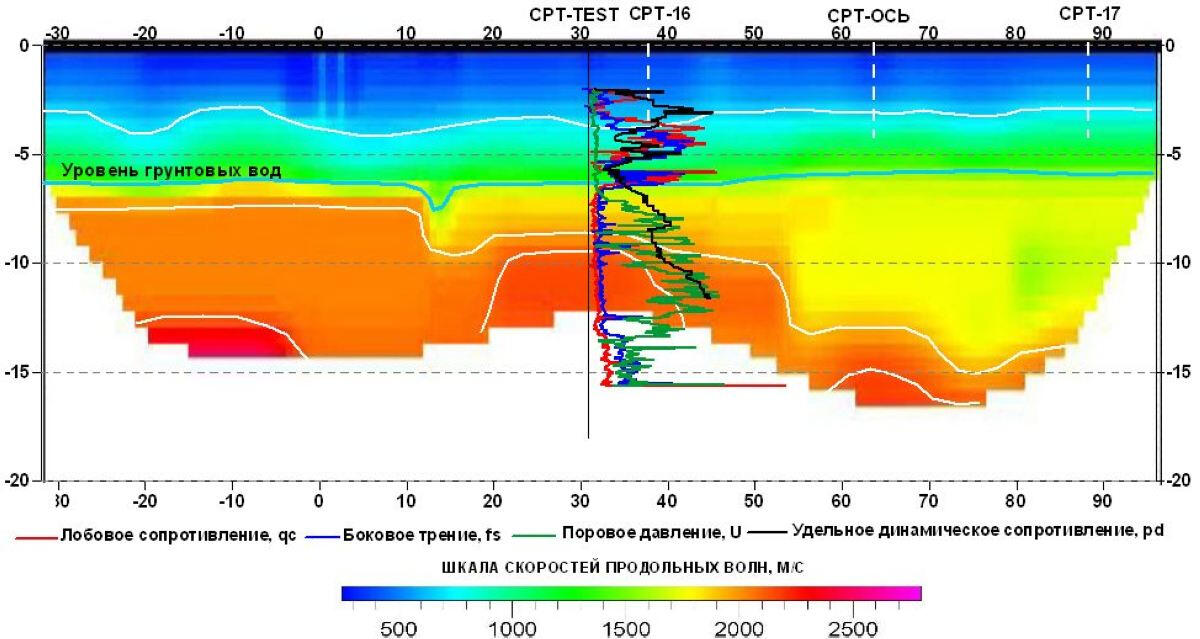
The seismic method of the refracted waves in many cases allows to establish position of level of ground waters in homogeneous arrays of sandy-clay soils, such, for example, as moraine loams of high power. The GPR method in such soils containing a large percentage of clay material is ineffective.A sharp increase in the velocity of longitudinal wave propagation at the boundary of full water saturation forms a strong refractive boundary, well traced in the velocity sections. Seismic boundaries associated with the water saturation surface have a clear correlation with the static penetration test data (CPT) – frontal resistance to cone, lateral friction and pore pressure.
Determination of moraine and bedrock roof depth
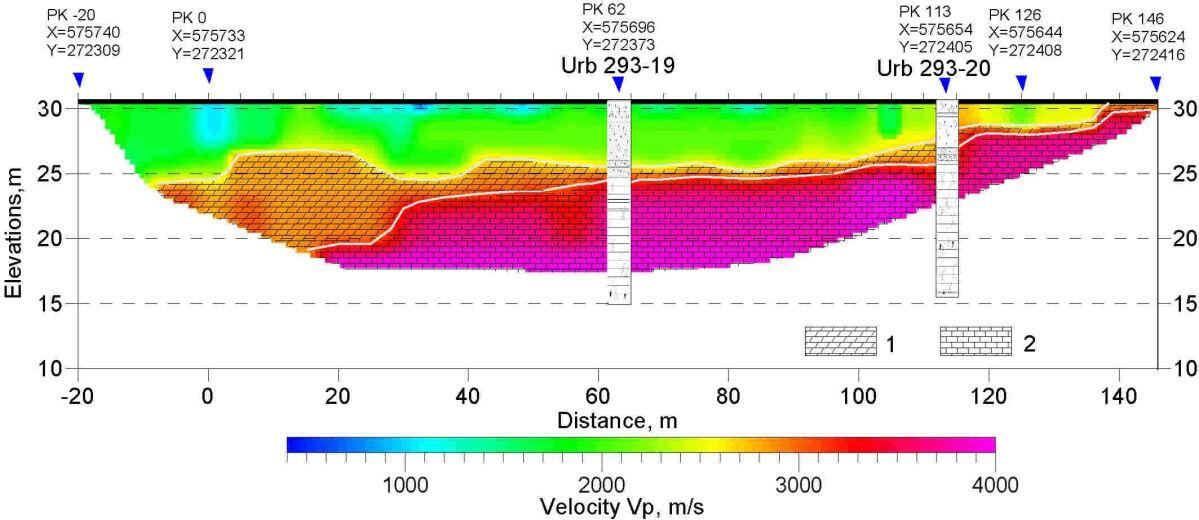
Shallow engineering seismic survey by reflected waves
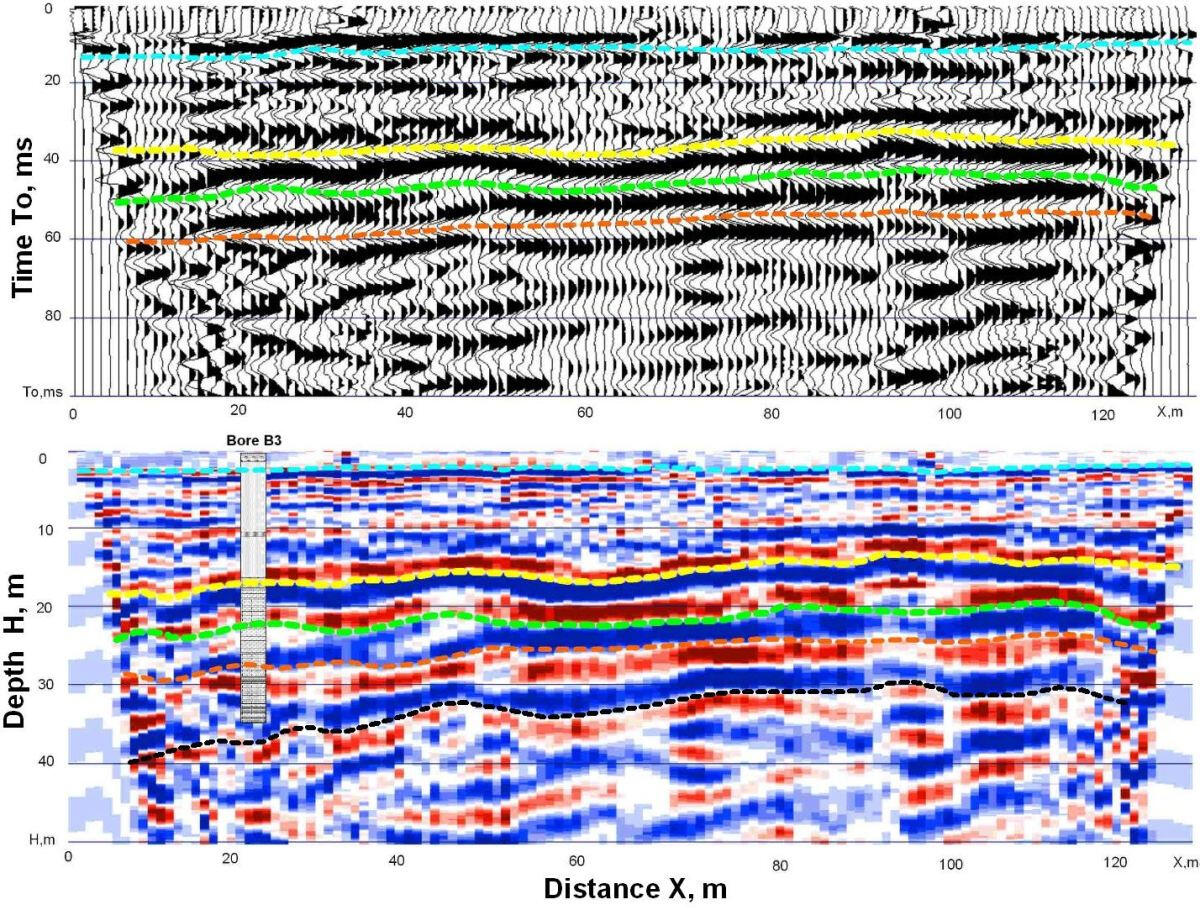
The problem of determining the surface of bedrocks or dense moraine soils depth arises in assessing the penetration of foundation piles, determining the lower boundary of sandy or gravel soils in assessing the reserves of construction materials in quarries.The roof of dense moraine soils or bedrocks is usually manifested in seismic sections of reflected waves as a clear, well-correlated reflecting horizon.Seismic profiling is performed by the method of multiple overlaps with the accumulation of signals reflected from the common depth point on the boundary (CDP).
GPR low-frequency sounding
The structure of the array of loose soils, the configuration of the reflecting boundaries in their thickness, the form of contact with the underlying moraine loams or bedrocks are most detailed displayed on the sections of GPR sounding. The depth of research on dry sandy soils with low-frequency dipole antennas can reach 10-15 m.In combination with the shallow-depth seismic survey by reflected waves, it is possible to significantly increase the depth of studies of the soil massif and rocks.
Seismic profiling by the method of refracted waves
One of the simplest and cheapest methods to study the structure of the bedrock surface is method of shallow-depth seismic exploration by refracted waves. The method usually does not allow to trace weak boundaries of the section in the thickness of loose soils, but gives a clear idea on the depth and configuration of a strong refractive boundary associated with the surface of the bedrocks.In addition, the method provides information about the lateral variability of physical properties of both the loose soil layer and the weathered surface layer of the bedrock.
Investigation of quarry sites
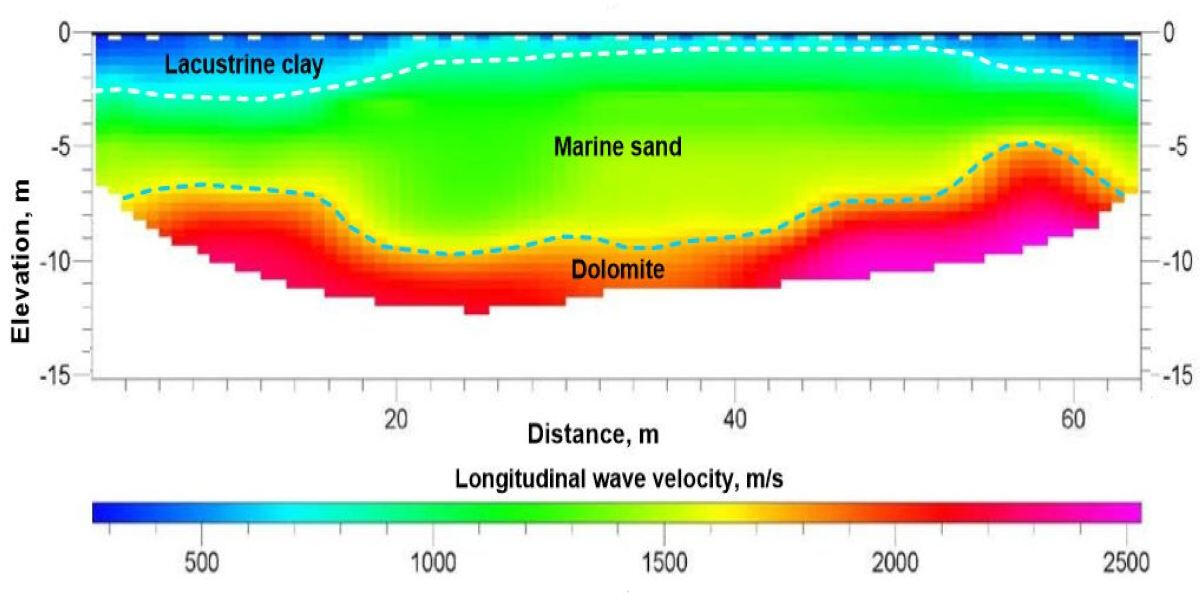
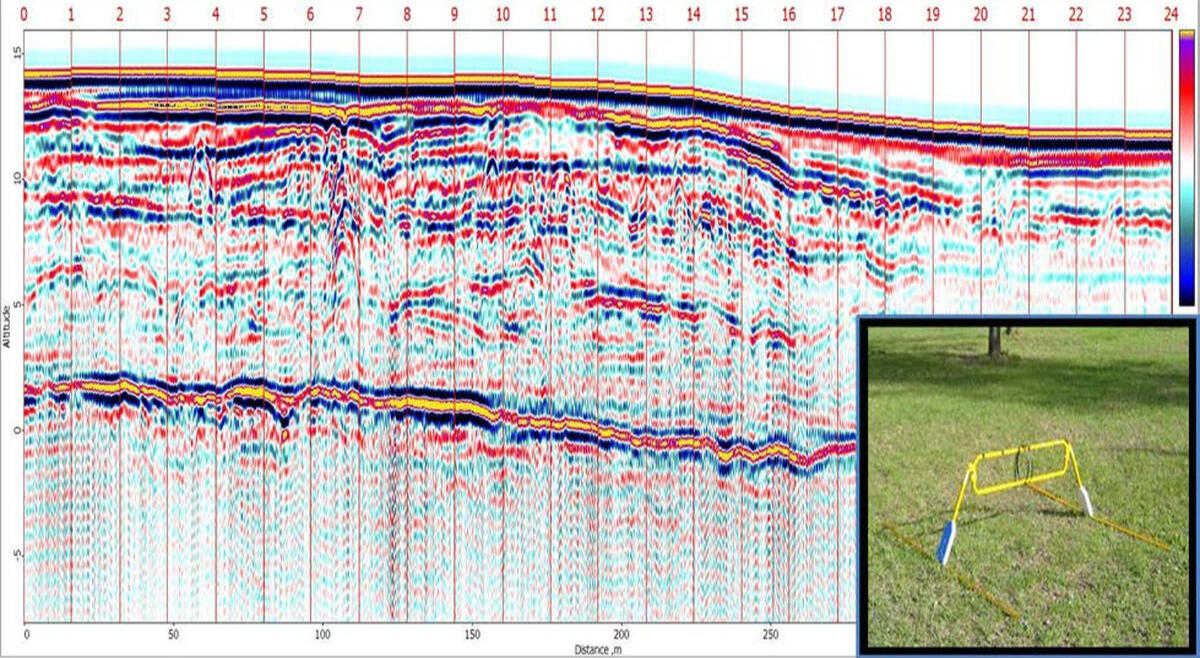
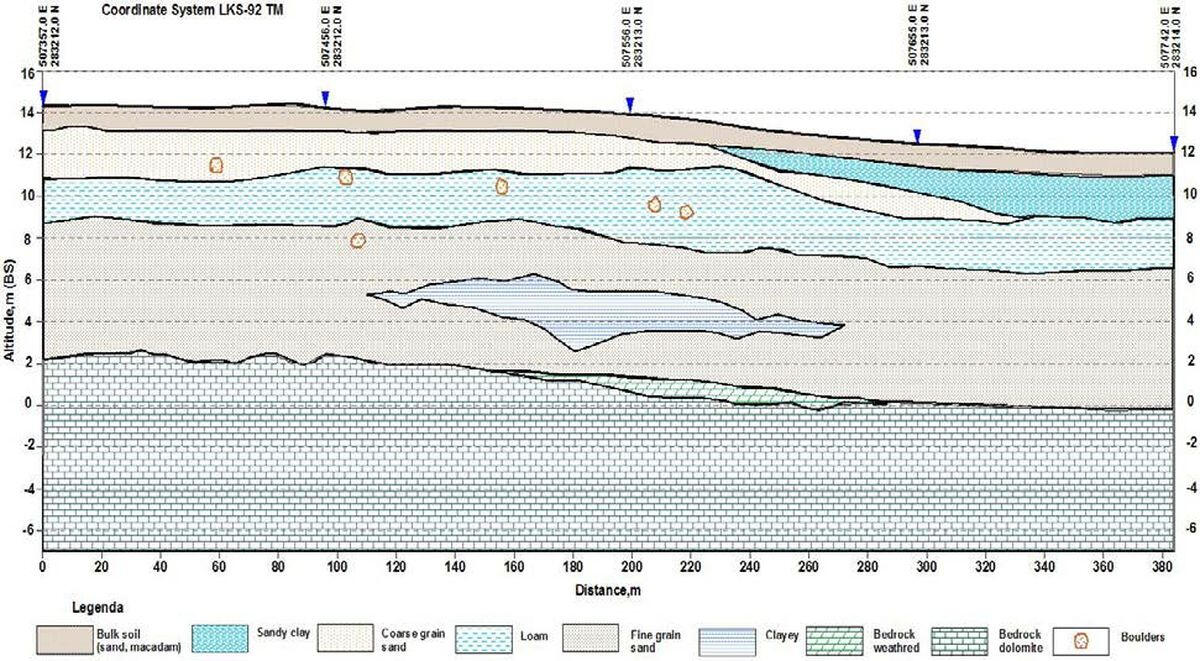
The section of longitudinal wave velocities on the site of the dolomite quarry
The shape of the surface of the bedrock dolomites and the thickness of overlapping loose Quaternary soils that determine the volume of overburdening operations on dolomite quarries are reliably determined by the method of shallow-depth seismic exploration by refracted waves. The sharp increase of longitudinal wave velocities on the roof of the dolomites allows to discover its shape even under conditions of complete water saturation of the covering loose soils and to optimize the direction of expanding the boundaries of quarry.
GPR section of the soil structure of the project sand quarry
To clarify the structure of soil massif on to be developed sand quarry, georadar sounding was used. GPR sections usually give a picture of the water-saturated areas and clay interlayers distribution in the thickness of sandy soils, allow to clarify the shape of the underlying bedrock sediments or moraine loams surface. The section was obtained with a dipole antenna of 75 MHz.
Interpretation of the GPR section
In the presence of reference wells, the position of reflecting boundaries obtained from GPR sections allows to estimate the thickness of productive layers with sands having different physical properties, to identify the places of ballast clay interlayers to be excavated, as well as the boundaries of watered areas of the soil massif.
Study of soils contamination with petroleum products
.
Identification of contaminated soil by electrical soundings (VES)
.
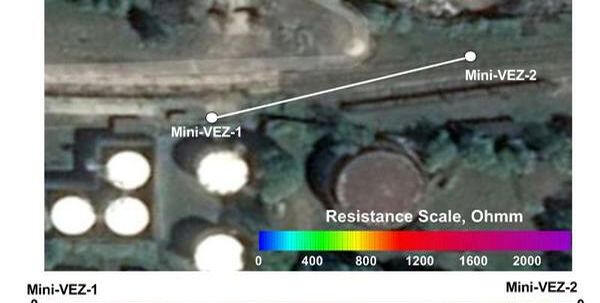
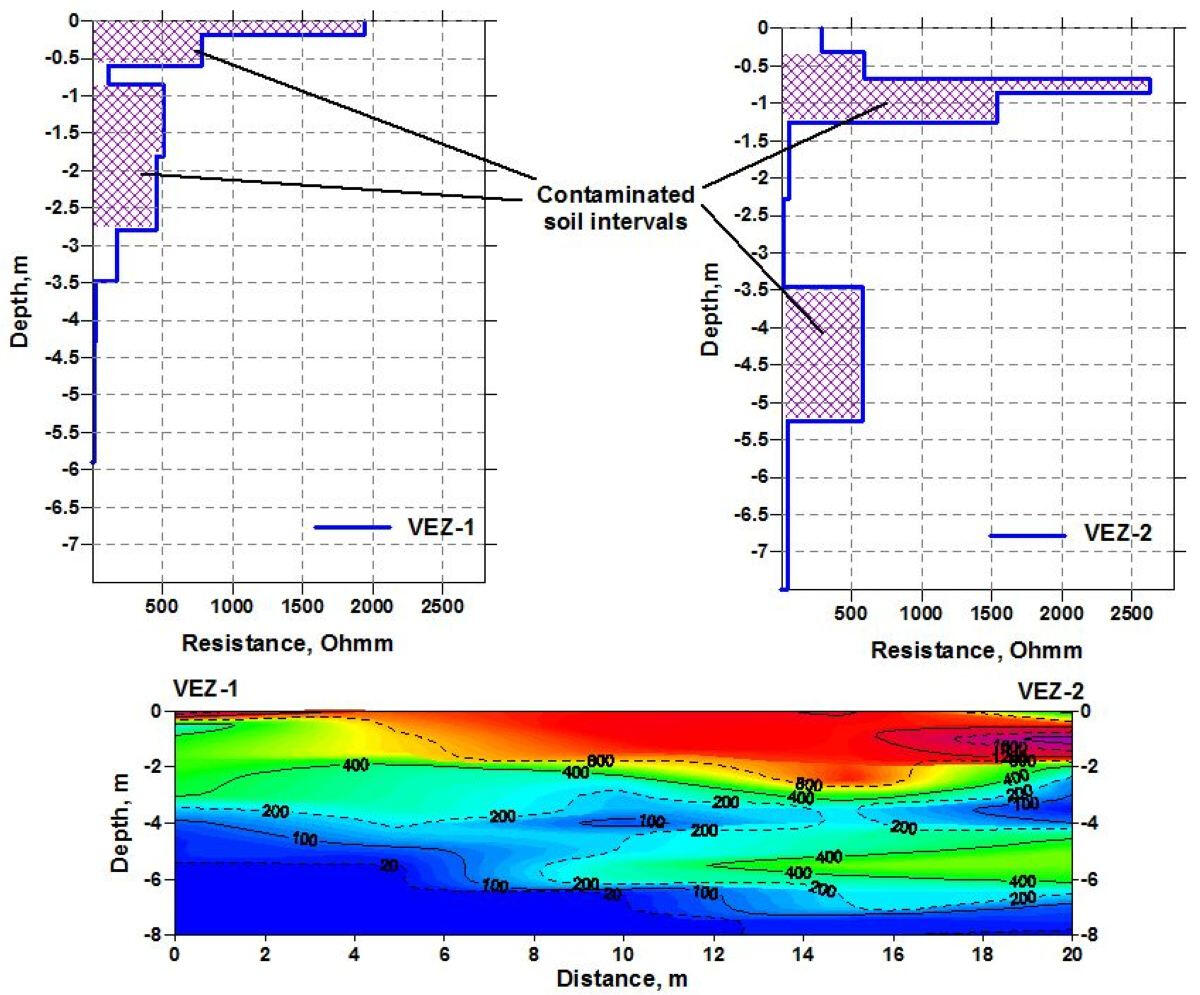
Soil contamination with petroleum products can be estimated by a sharp increase in the electrical resistance of both dry and water-saturated soils. For localization of contaminated sites, optimal by technology and cost is the joint application of methods of electrical prospecting with direct current (mini-VES and electrical tomography) and GPR sounding. VES data give a layer-by-layer characteristic of intervals with abnormally high values of electrical resistance.
.
.
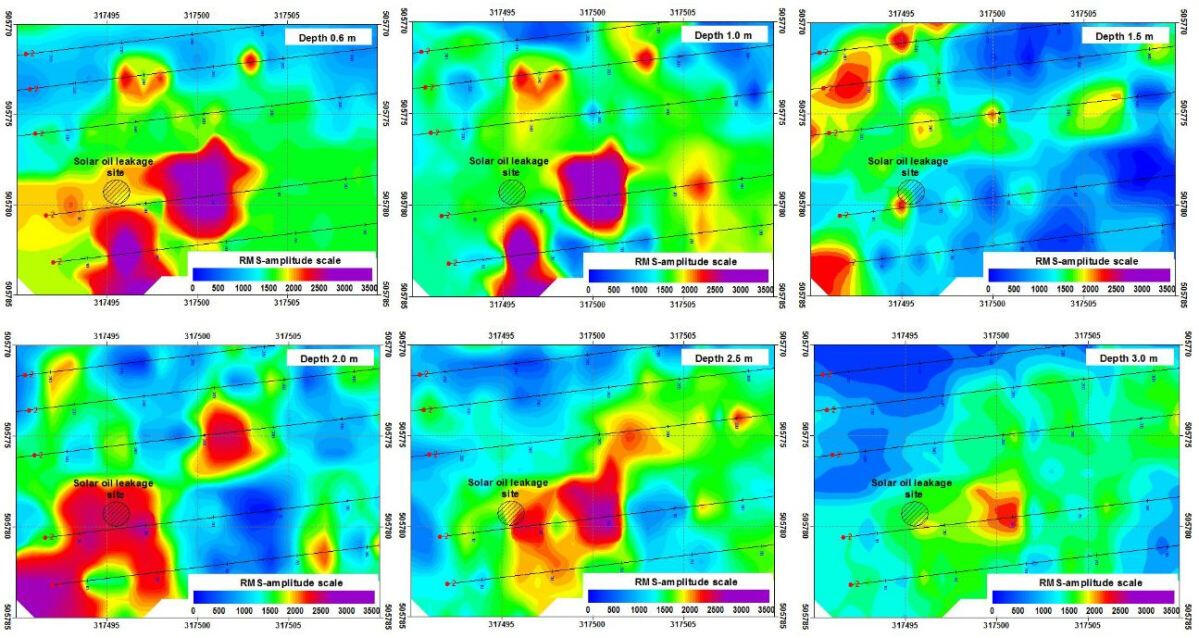
Layer-by-layer mapping of soil contamination by oil products on GPR records
Areal GPR survey allows to obtain horizontal cross sections of the reflection intensity at the boundaries of weakly permeable to electromagnetic waves contaminated with petroleum products sites and assess their areal distribution near the source of contamination.
Suffosion processes in soil foundations
.
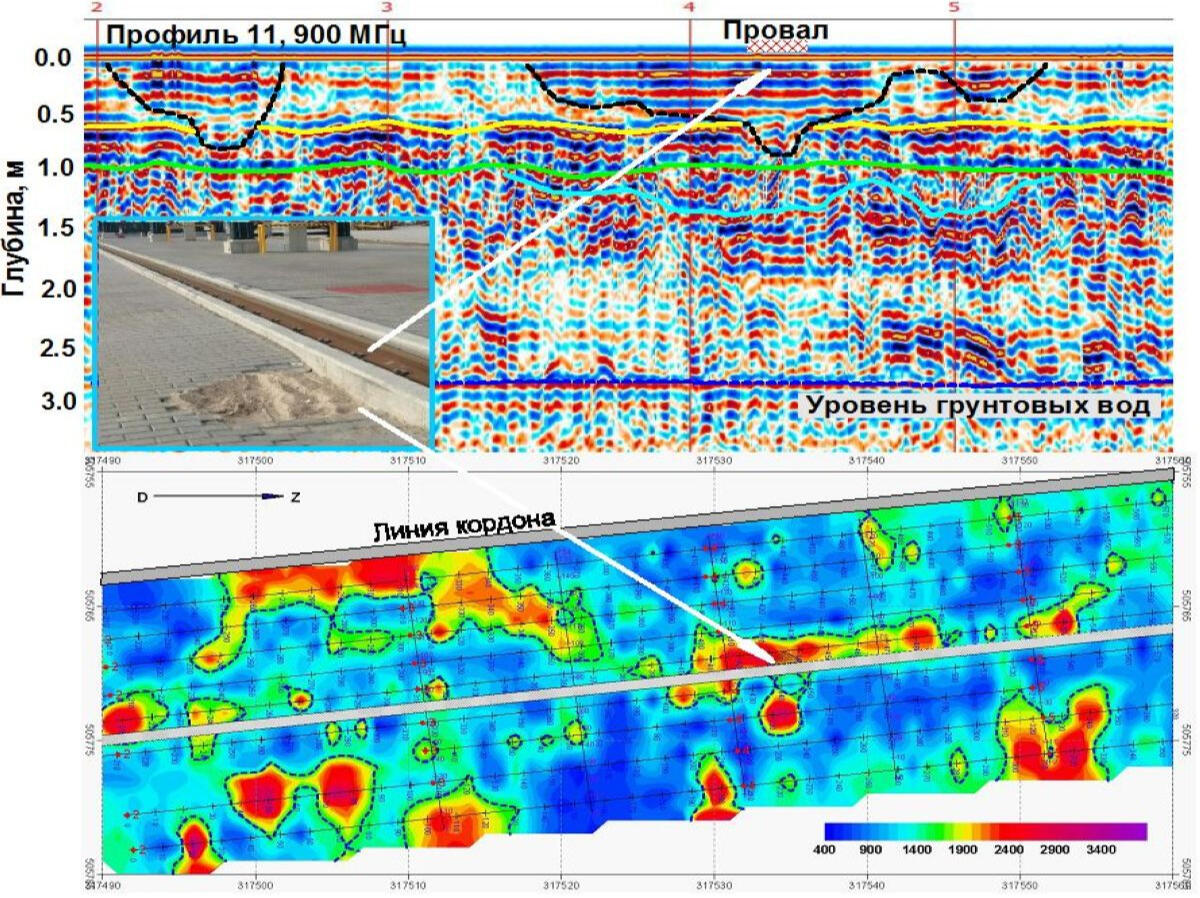
Suffosion channels at the soil foundation of the cargo berth according to GPR data
GPR sounding with high-frequency shielded antennas (900 MHz, 1.5 GHz) on a dense network of profiles makes it possible to identify the suffosion channels in the surface layer of the sandy bases of the quays. Channels and decompacted areas of suffosion removals are mapped as areas of increased amplitudes of reflections from the lower boundaries of the depressions or voids under a rigid berth coating.
Zone of increased filtration and decompaction of rocks under the foundation of an ancient Church
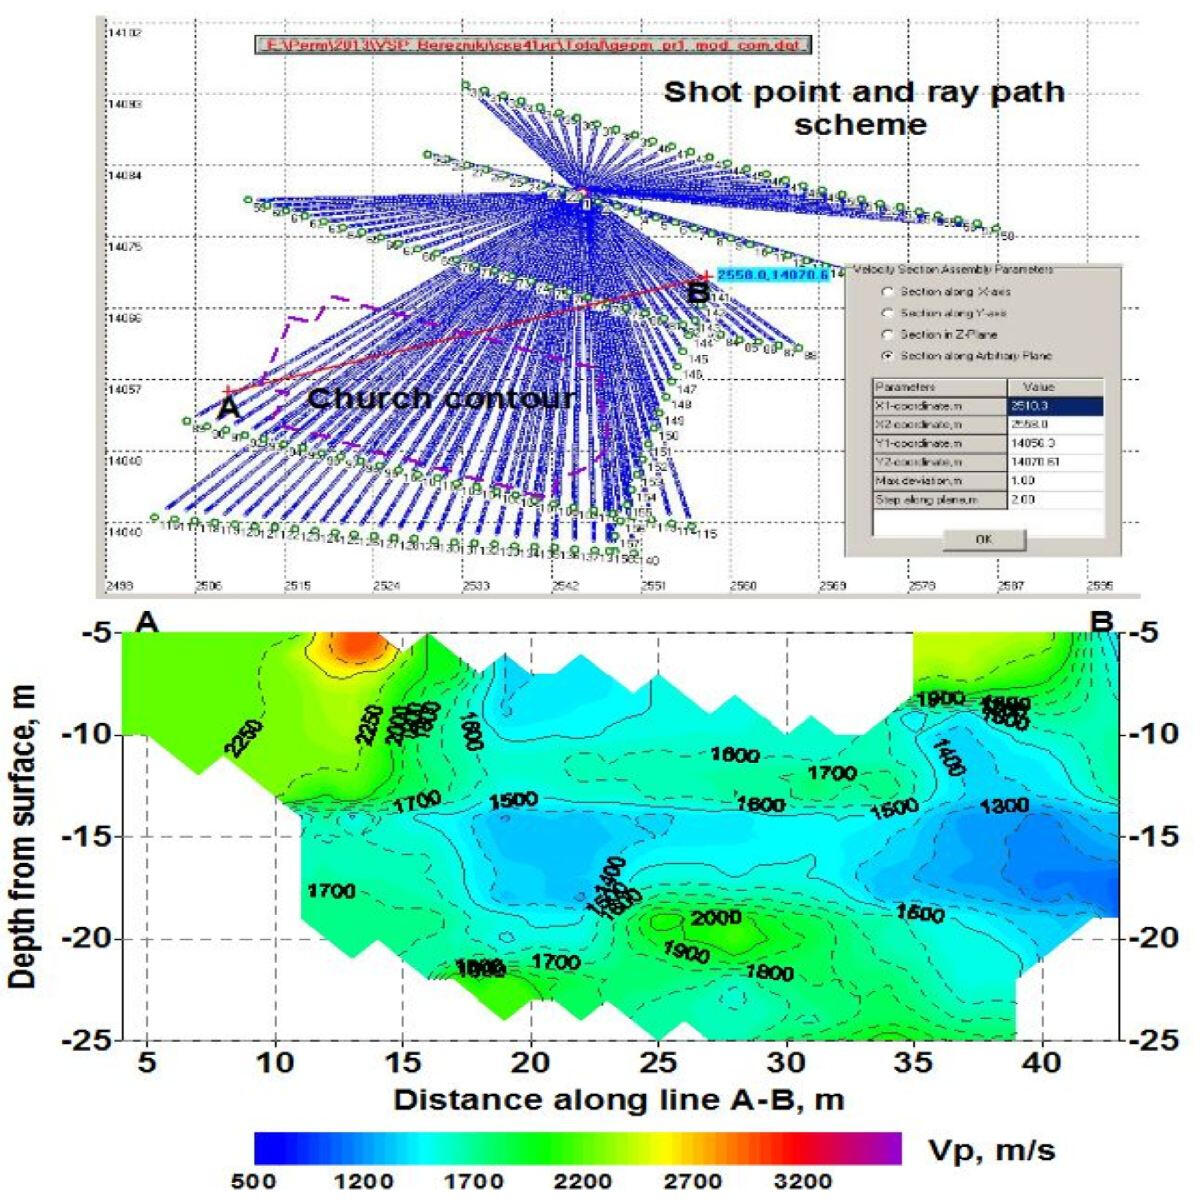
Deeper areas of of suffosion processes evolution in the foundation of the structures can be identified by seismic method of non longitudinal VSP and crosshole seismic. An example is the identification of a vast zone of reduced longitudinal wave velocities in the thickness of halogen-carbonate rocks at a depth of 15-20 m under the subsidence of the ancient Church. Identified according not longitudinal VSP low-velocity anomalies associated with the processes of leaching in the high filtration velocity zone of underground waters.
Measurement of soil and structures vibration
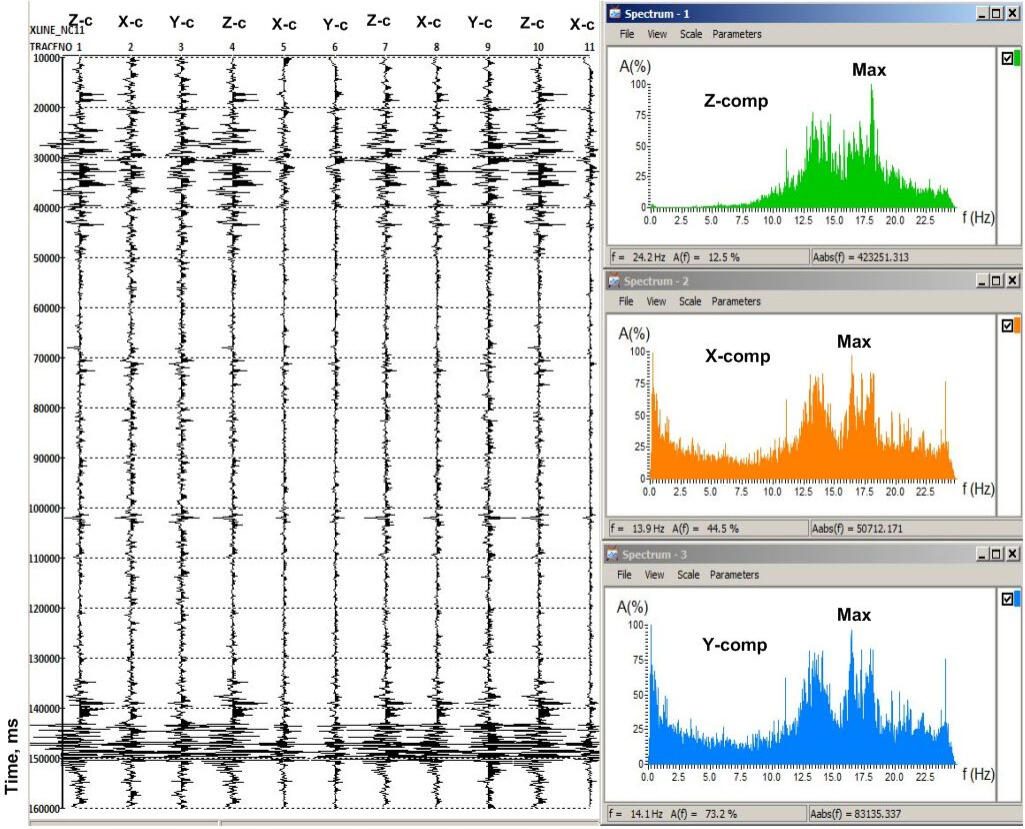
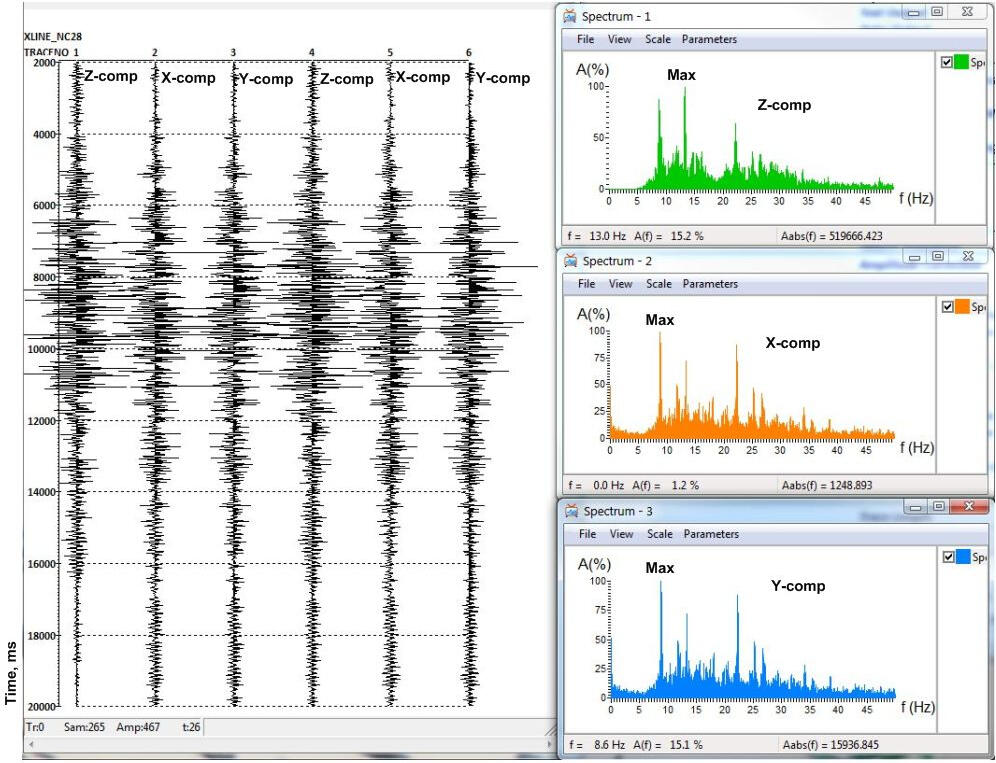
Study of sources and spectral composition of vibrations at the construction site
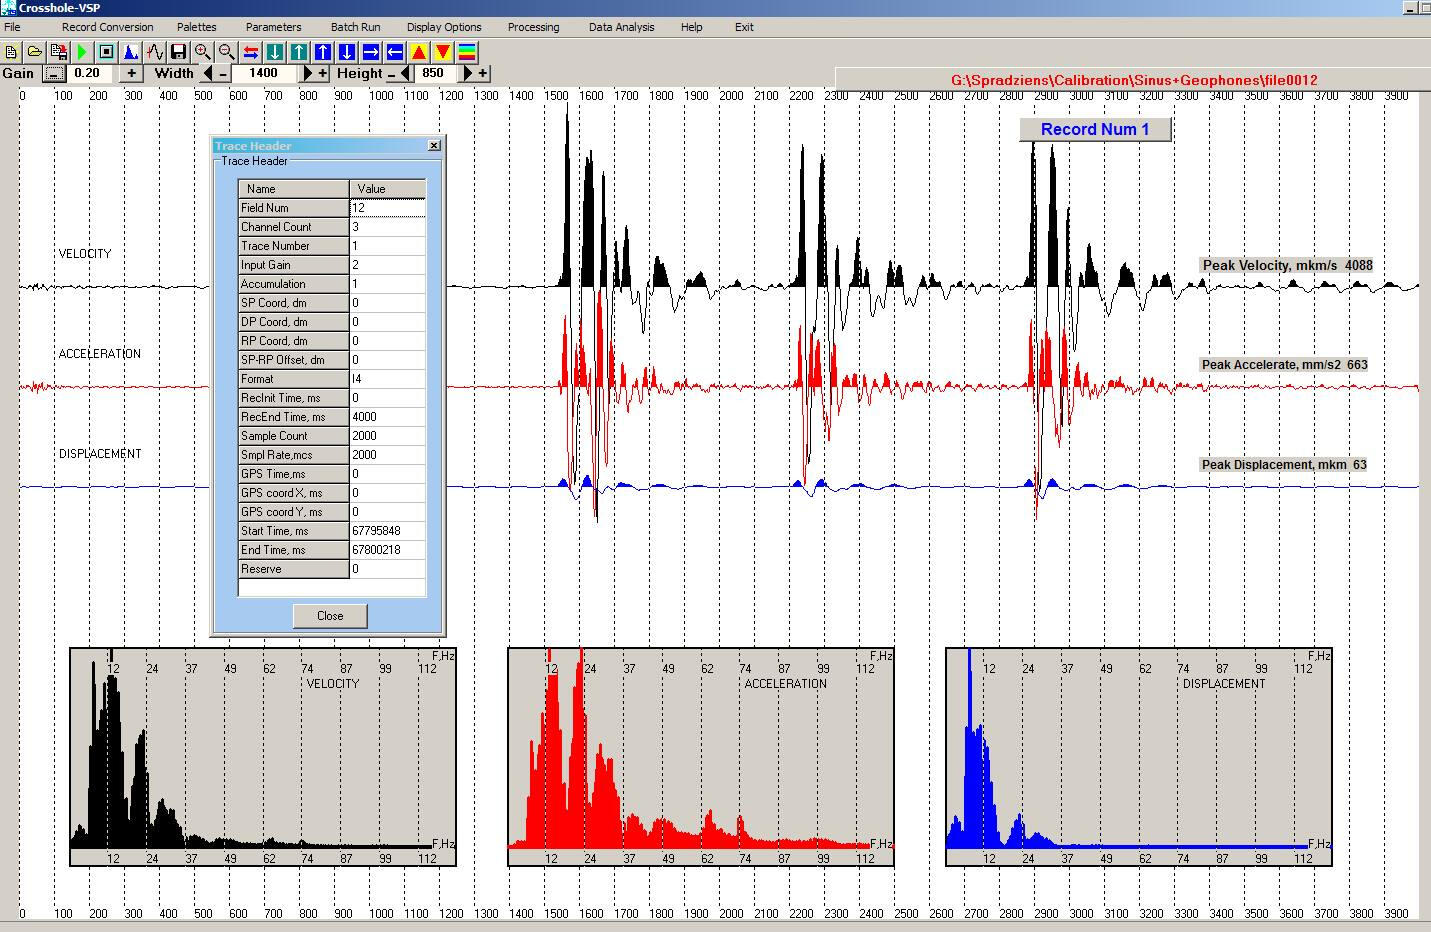
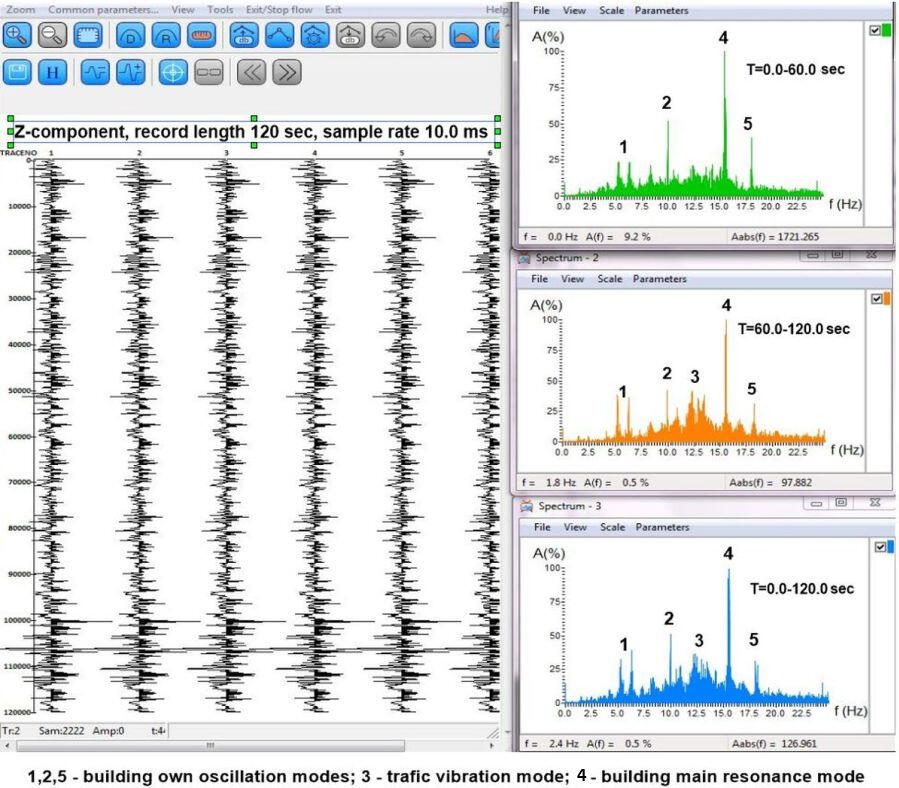
An important factor in the vibration resistance of a structure is the ratio of its own resonant frequencies and the predominant vibration frequencies propagating in the base soil mass. Vibration measurements are performed with three-component displacement sensors or accelerometers in passive mode. Spectral analysis of records obtained over fairly long periods of time (minutes, tens of minutes) in various parts of a building or project construction site makes it possible to identify the maximum frequencies of various vibration modes and their sources (microseisms, transport noise, vibrations of operating mechanisms).
Assessment of the permissible level of vibrations during explosion and driving of foundation piles
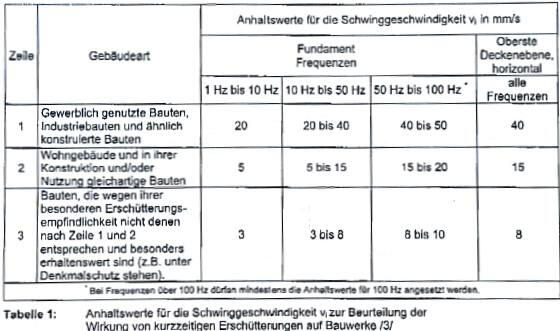
To assess the permissible level of vibration impact on residential buildings, industrial buildings and underground communications, various international standards (DIN 4150-3:1999, BS 7835-2:1993, etc.) define limits for permissible displacement speed in different vibration frequency ranges. For example, the table of permissible displacements is taken from the German national standard DIN 4150-3:1999.In some cases, when the depth of laying a monolithic foundation or the depth of driving piles is large, the distribution of these two quantities along the depth of the soil mass is important. Depending on the physical properties of the soil mass, the level of stress during vibrations in its deep parts can be significantly higher than on the surface.To assess the effect of vibration on the buried parts of foundations, acceleration values are used, for which an accelerogram is calculated from velocity diagrams, or accelerations are measured directly with accelerometers.In addition, to assess the level of vibrations at different depths, it is necessary to know the distribution of the propagation velocities of shear waves in the soil mass, for which purpose special soundings are carried out at the vibration measurement sites using shallow seismic studies with surface waves using a multichannel single-component geophone installation to record the vertical component of the displacement.
Vibrations of building elements and spectra of main modes
Vibration measurements inside buildings and structures are performed to assess the occurrence of resonant vibrations of parts of the structure under the influence of external influences.Three-component displacement sensors (geophones) or accelerometers installed in different parts of buildings are used for measurements. The dominant frequencies of the vibration spectra recorded during shock, periodic impacts, or transport noises are compared with the calculated resonant frequencies of the structures.
Oscillations of soil foundations under the influence of road transport
Transport noises are the most common type of vibration. The spectral composition of vertical and horizontal oscillation components in the soil massif varies significantly during the passage of waves from road transport.The spectra of horizontal components are substantially enriched by low frequencies, the most dangerous for the foundations of structures. However, the amplitude of displacements in horizontal components is usually several times lower than the vertical component.
The vibrations in the ground from the railway transport
The spectrum of vibrations from passing freight and electric passenger trains in comparison with the spectrum of vibrations from the highway significantly shifted towards low frequencies. The most dominant frequencies are in the band from 6 to 40 Hz. The enrichment of the spectra of horizontal components with low and ultra-low frequencies (from decimal parts of Hz up to 3-4 Hz) is also noted.Several distinct narrow modes are distinguished on the spectra due, apparently, to the peculiarities of the structure of the railway track and the passage of the wheels at the joints of rails.The greatest intensity of vibrations is observed during braking and acceleration of the trains.
Evaluation of physical-mechanical properties of soils
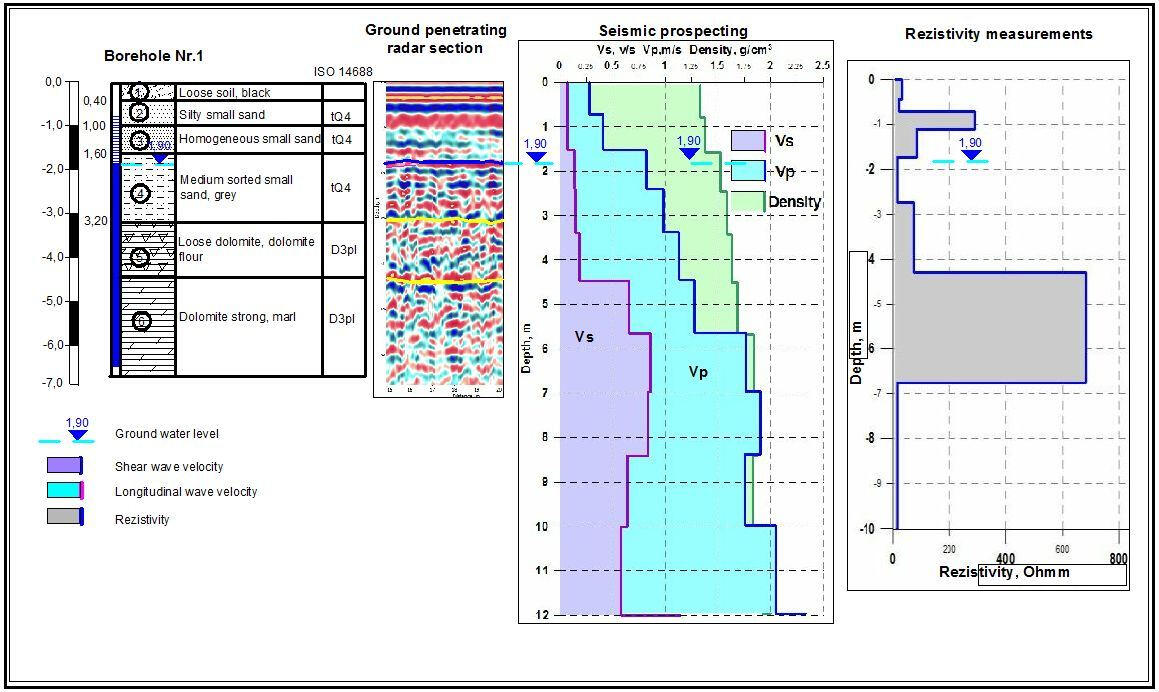
Integrated shallow geophysical surveys
The complex of shallow-depth geophysical methods together with drilling of geotechnical wells to the depth of 4-6 m with selection of soil samples provides comprehensive information for drawing up the geotechnical conclusion for construction of buildings of the 1st category (houses, one-storey industrial constructions), including the design of electrical earthing.
The complex includes:
- multi-wave seismic exploration,
- electrometry by the VES method,
- GPR sounding,
Seismoacoustic measurements in wells
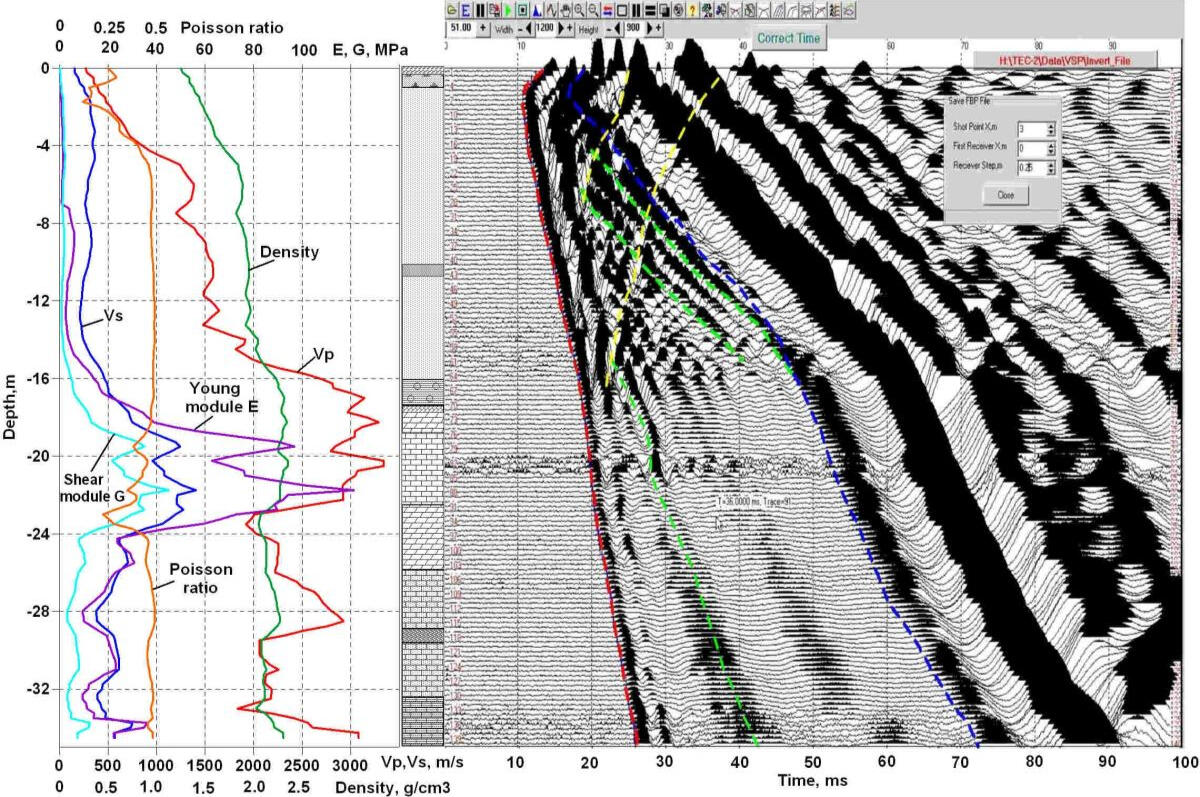
Borehole seismoacoustic methods of assessment of physical and mechanical properties of soils and rocks are used in surveys on large objects of industrial and civil engineering.The main research method is vertical seismoacoustic profiling (VSP) with the excitation of pulses on the earth's surface and the reception of oscillations by hydrophone receivers in wells with a depth of up to 35-40 m and filled with water.On the basis of measurement the velocity of longitudinal and transverse waves propagation soil density, elastic modules, Poisson's ratio are determined.
Borehole methods in combination with seismic exploration
Micro seismic log (MSL) and VSP methods are used to study elastic wave velocities in the upper part of the geology section in conventional seismic exploration, to assess the physical-mechanical properties of soils and rocks in the design of water intake wells, to clarify the geological structure of the section of non-metallic mineral deposits and building materials (sand, gravel, marl dolomite).The depth of the detailed dismemberment of the section consists of 100 meters or more. The estimation of forecast deformation and strength properties of soils - total deformation modulus, angle of internal friction, the specific adhesion is performed. The most effective application of VSP in a complex with data of shallow geotechnical seismic prospecting.
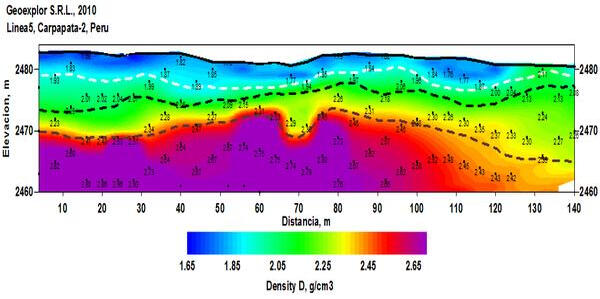
An example of calculating predicted physical properties based on seismic data
This section of the predicted density of the soil-rock mass was obtained on the basis of data from the seismic method of refracted waves at the design site of a hydroelectric power station on the mountain river Carpapata (Peru) when it was impossible to carry out drilling work in the inaccessible conditions of a high-mountain gorge.
Subsidence of the Earth’s surface and soil collapses
Analysis of surface wave energy attenuation anomalies
The seismic records used on this page were obtained by the field team of the Department of Active Seismoacoustics of the Mining Institute of the Ural Branch of the Russian Academy of Sciences (Perm).The most intense Rayleigh surface waves recorded on shallow seismic records often show significant variability in amplitude and frequency along the observation profile. One of the reasons for this phenomenon may be lateral inhomogeneities of the near-surface part of the soil massif, including zones of subvertical fracturing, which are reflective boundaries for waves propagating along the earth's surface.In places where such boundaries appear, areas of “feeding” the energy of the surface wave due to its reflection appear.
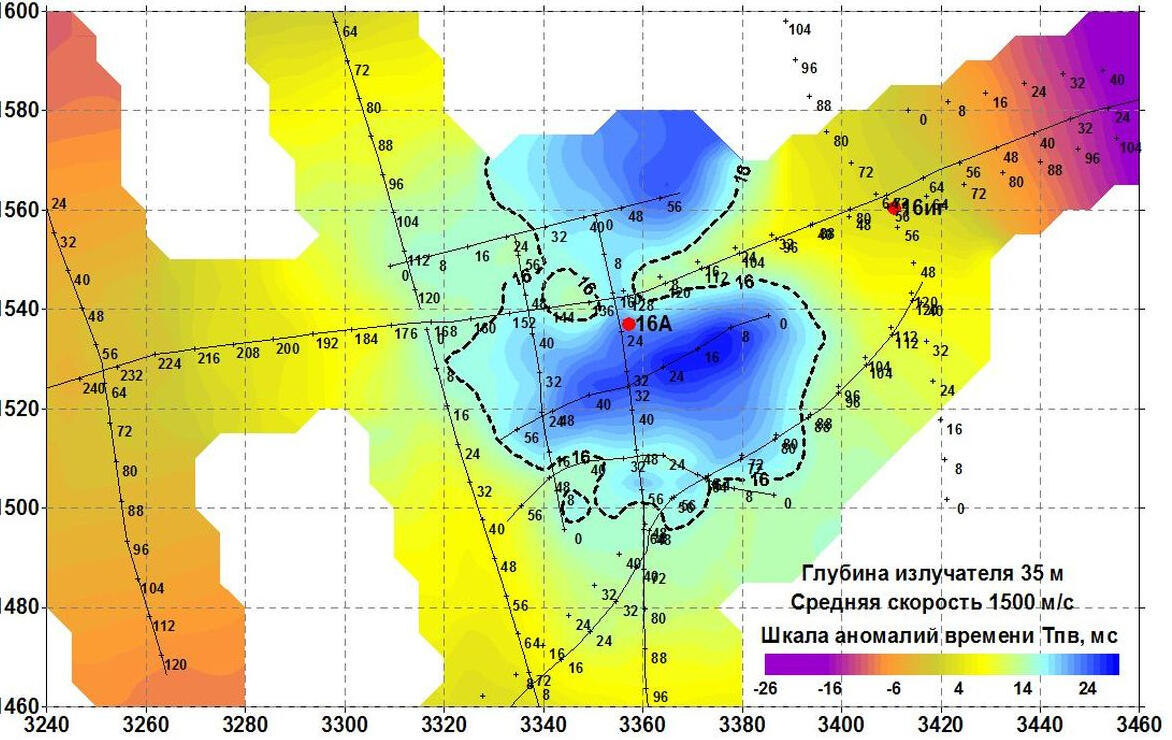
Elastic wave travel time anomaly detection in areas of subsidence
One of the signs of decompaction in the thickness of the soil massif and possible settling of its surface is a sharp increase in the time of elastic waves propagation on this site.Methods for detecting such anomalies may be different. One of the most effective is the inverted VSP with the location of receiving lines on the surface and by excitation of elastic waves pulses at different depths in the well. Anomaly at the location of the potential collapse of the soil in the mining field is illustrated. Field data of this section are obtained by the field team of the department of active seismic of Mining Institute UB RAS (Perm).
Manifestation of low-velocity anomalous zones on the not longitudinal VSP profiles
On longitudinal wave velocity vertical section along the inverted VSP profile at the place of manifestation of increased travel time anomaly the distinct wide zone of low velocities of longitudinal waves propagation Vp can be traced with a sharp, almost vertical Eastern border.Wide anomalous zone is traced to the depths of about 20-25 m. Deeper a narrowing is observed, probably representing the channel of surface water filtering in the thickness of soil and bedrock above the salt workings.
Spatial distribution of anomalous zones displaying on horizontal sections
Areal distribution of anomalous low-velocity zones displayed on horizontal cross sections obtained from reversed VSP velocities Vp spatial sampling.The complex elongated shape of the velocity anomalies of Vp indicates their possible adherence to the orthogonal system of faults and to the ancient buried channels and valleys developed in the thickness of the bedrocks and filled with weak soils and materials of the weathering crust.
Equipment
Georadar "ZOND-12E"

Examples of multi-frequency GPR records
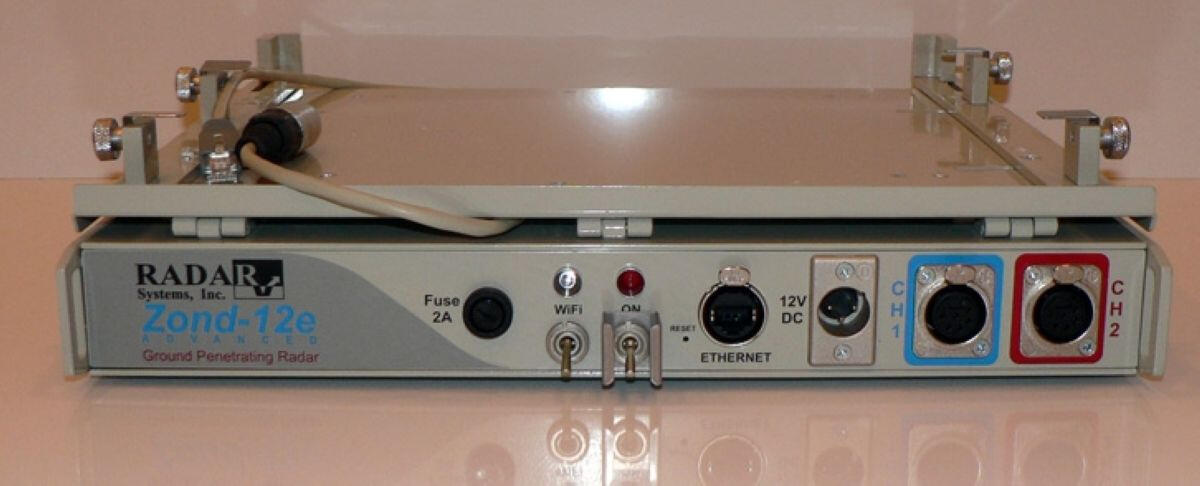
ZOND-12E georadar is a digital, , portable radar of subsurface sounding carried by one operator, designed to solve a wide range of geotechnical, geological, environmental, engineering and other tasks where there is a need for non-destructive and operational monitoring of the environment. During the sounding, operator receives real-time information on the display in the form of the so-called radar profile . At the same time, the data is written to a hard disk of Notebook PC for further use (processing, printing, interpretation, etc.).A complete set of georadar includes a central unit with a Notebook computer fixed on a special platform, a set of antennas for different probing frequencies, software, and various accessories.
The antenna is made in a dust-splash-proof option, and even allow for short-term immersion in water. Surface antennas have a substrate made of teflon, resistant to abrasion. Control of all georadar parameters are computer controlled.
Main technical specifications
• version: single-channel or double-channel
• time range: user selected from 1 to 2000 ns with 1 ns step.
• frequency of pulse repetition of transmitter: 115 kHz.
• number of runs per second: 56 (for single channel), 80 (for dual channel)
• number of points on a trace: 512 (for single and dual channel performance)
• digital data representation: 16 bit
• highpass filter: user selectable: Soft, Hard, Super strong, customized digital. filter.
• data transfer: Ethernet.
• power supply: 10.5 - 13V 0.4 A (portable battery for single and dual channel)
• dimensions: 35x50x5.5 cm.
• weight: 3.2 kg.
Receiving-emitting antennas
The antenna is made in a dust-splash-proof option, and even allow for short-term immersion in water. Surface antennas have a substrate made of teflon, resistant to abrasion. Control of all parameters of radiation and reception is carried out from the computer. Dipole antenna by increasing the length of the emitting rods from 1.0 to 3.0 m can be configured to generate a pulse with a frequency of 150, 75 and 37.5 MHz.37.5/ 75 / 150MHz low frequency dipole antenna (left), high frequency shielded antenna 900MHz (center) and 1.5 GHz high frequency shielded antenna (right)
Telemetry recording system for shallow seismic exploration
Manufacturer NPP "Intromag", Perm, Russia
Field layouts
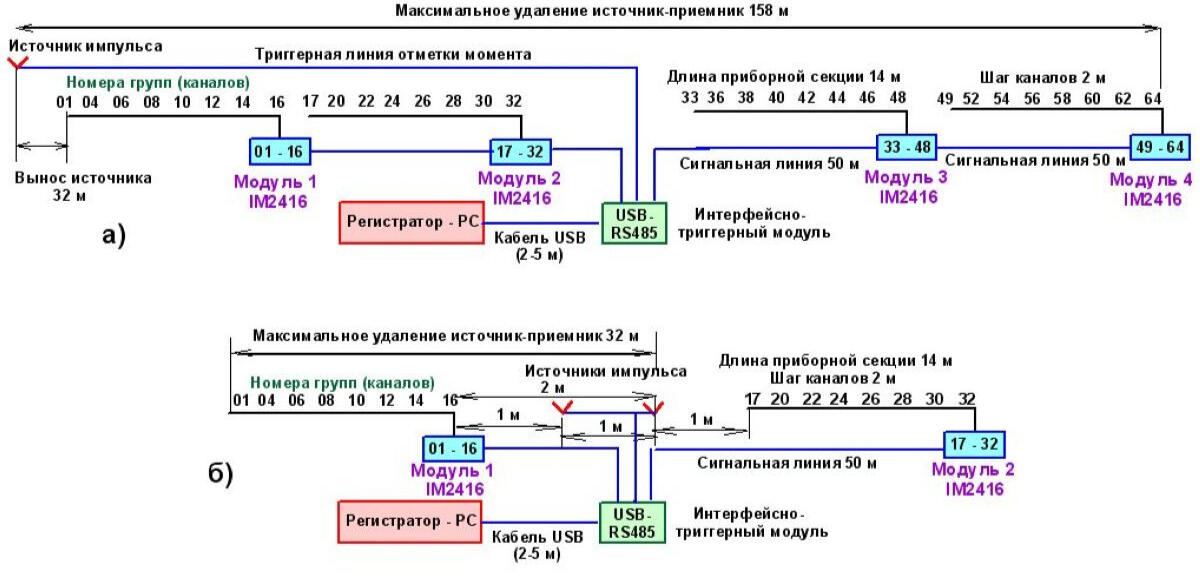
Typical diagram of an observation system when working using the method of reflected and refracted waves (a) and surface waves (b)
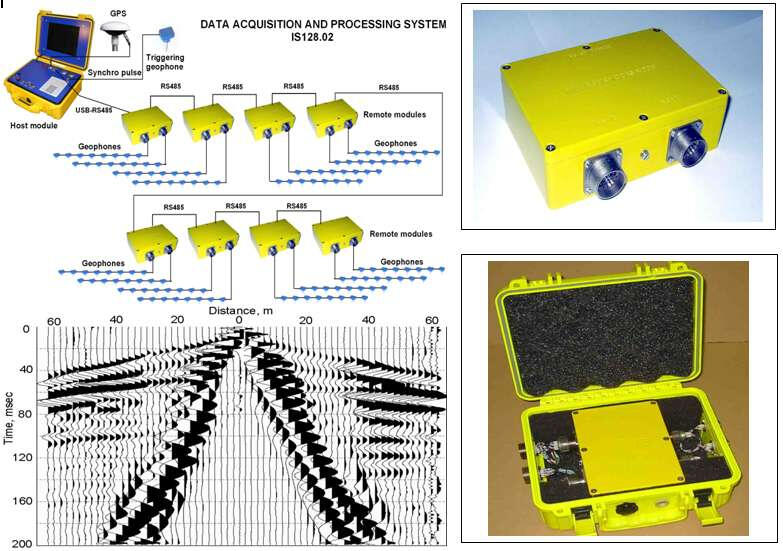
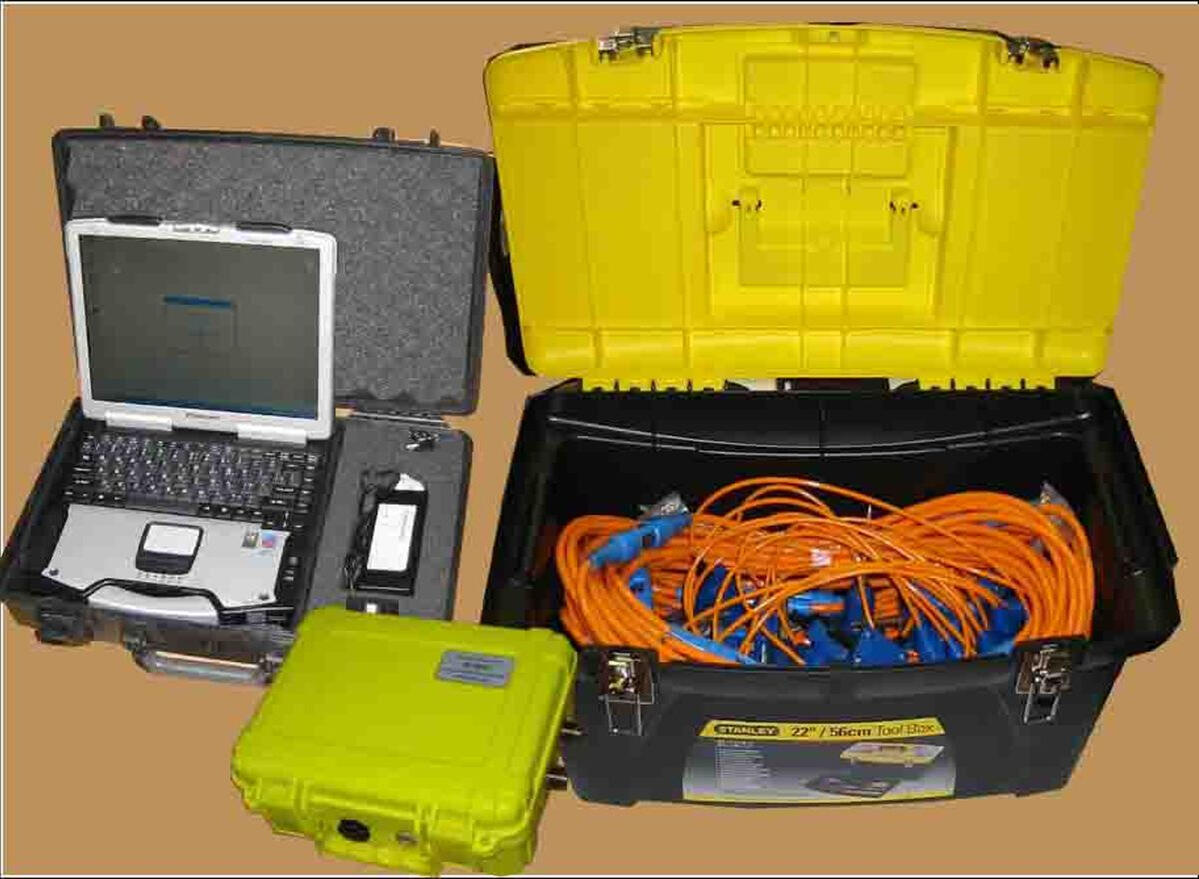
IS128.03 seismoacoustic recorder kit with one remote module
Applications
• seismoacoustic investigations with frequency range from 2 Hz up to 8000 Hz
• profiling at the ground surface and in shallow boreholes
• upper part of geological section studying via refracted, reflected and surface wave techniques
• geotechnical investigations
• technical condition, environment control and monitoring of the on-land and off-shore structures
• acoustic investigations of the road surfacing, substructures and foundations
• off-shore shallow seismic surveys and continuous subbottom profiling in single-channel and multi-channel modesDuring operations with relatively weak power sources of the seismic pulse initiations the recorder provides low signal stacking. Hardware stacking of seismoacoustic signals is carried out before record transmitting into the long duration memory on a hard disk. Remote 16-th channel distributed modules with low power consumption can be connected to the central module via two-wire high-speed USB-RS485 or WiFi interface.
Main technical characteristics of the complex
Mostly convenient for field work technology of and for a noise stability of recorded signals is a wiring sheme for remote modules connection to a conventional portable Notebook computer via an USB port using a specialized high-speed converter USB-RS485 interface and synchronization unit records.In this case, separate geophone sections are connected directly to the remote modules on the profile, which are connected to each other and then connected to the interface module via a digital two-wire communication line, thereby significantly reducing the level of electromagnetic interference to the connecting signal cables and extensions. Data transfer from the interface module to the computer is carried out either via a two-wire line, or, at distances up to 100-120 m, on the radio using the WiFi interface.
Specification
1) Number of plug-in modules (set by user) - 1-16
2) Number of remote module channels 16
3) Input resistance (settable 0.001-100 MOhm, set by user)
4) Frequency range at - 3 dB 2-8000 Hz
5) Dynamic range at dt=1ms 130 dB
6) Conversion bit size, delta/sigma 24 bits
7) Amplitude sampling period 0.03 - 50.0 ms
8) Number of accumulations, 32-bit output code - 256
9) Initial gain levels 6,12,18,24,30,36 dB
10) The frequency of excitation pulses is up to 2 per second.
11) Upper limit filter frequencies 125 - 8000 Hz
12) High-pass filter cutoff slope 36 dB/oct
13) Notch filter 50,100,150 Hz, 48dB
14) Number of samples for each channel (optional) 8192/16384
15) Noise level referred to input at 1 ms 1.3 µV
16) Input signal range +/- 5V
17) Mutual influence coefficient at 100 Hz < -100 dB
18) Common mode noise rejection depth >110 dB
19) Output code format integer 32 bits
20) Primary power supply 12 V
21) Control processor, min Notebook/Pentium
22) Data transfer USB, RS485
23) RAM, min 2 GB
24) HDD, min 30 GB
25) Display, min LCD TFT 12.3”, SVGA 800x600
26) Degree of protection from environmental influences IP65
27) GPS NMEA-183 protocol
28) Dimensions of the central module 378x330x178 mm
29) Weight of the central module 8.0 kg
30) Dimensions of the remote module 171x121x55 mm
31) Remote module weight 1.1 kg
32) Operating temperature:
central module 0 deg.C -+40 deg.C
remote module -20 degrees C +50 degrees C
Service program for registration and data collection
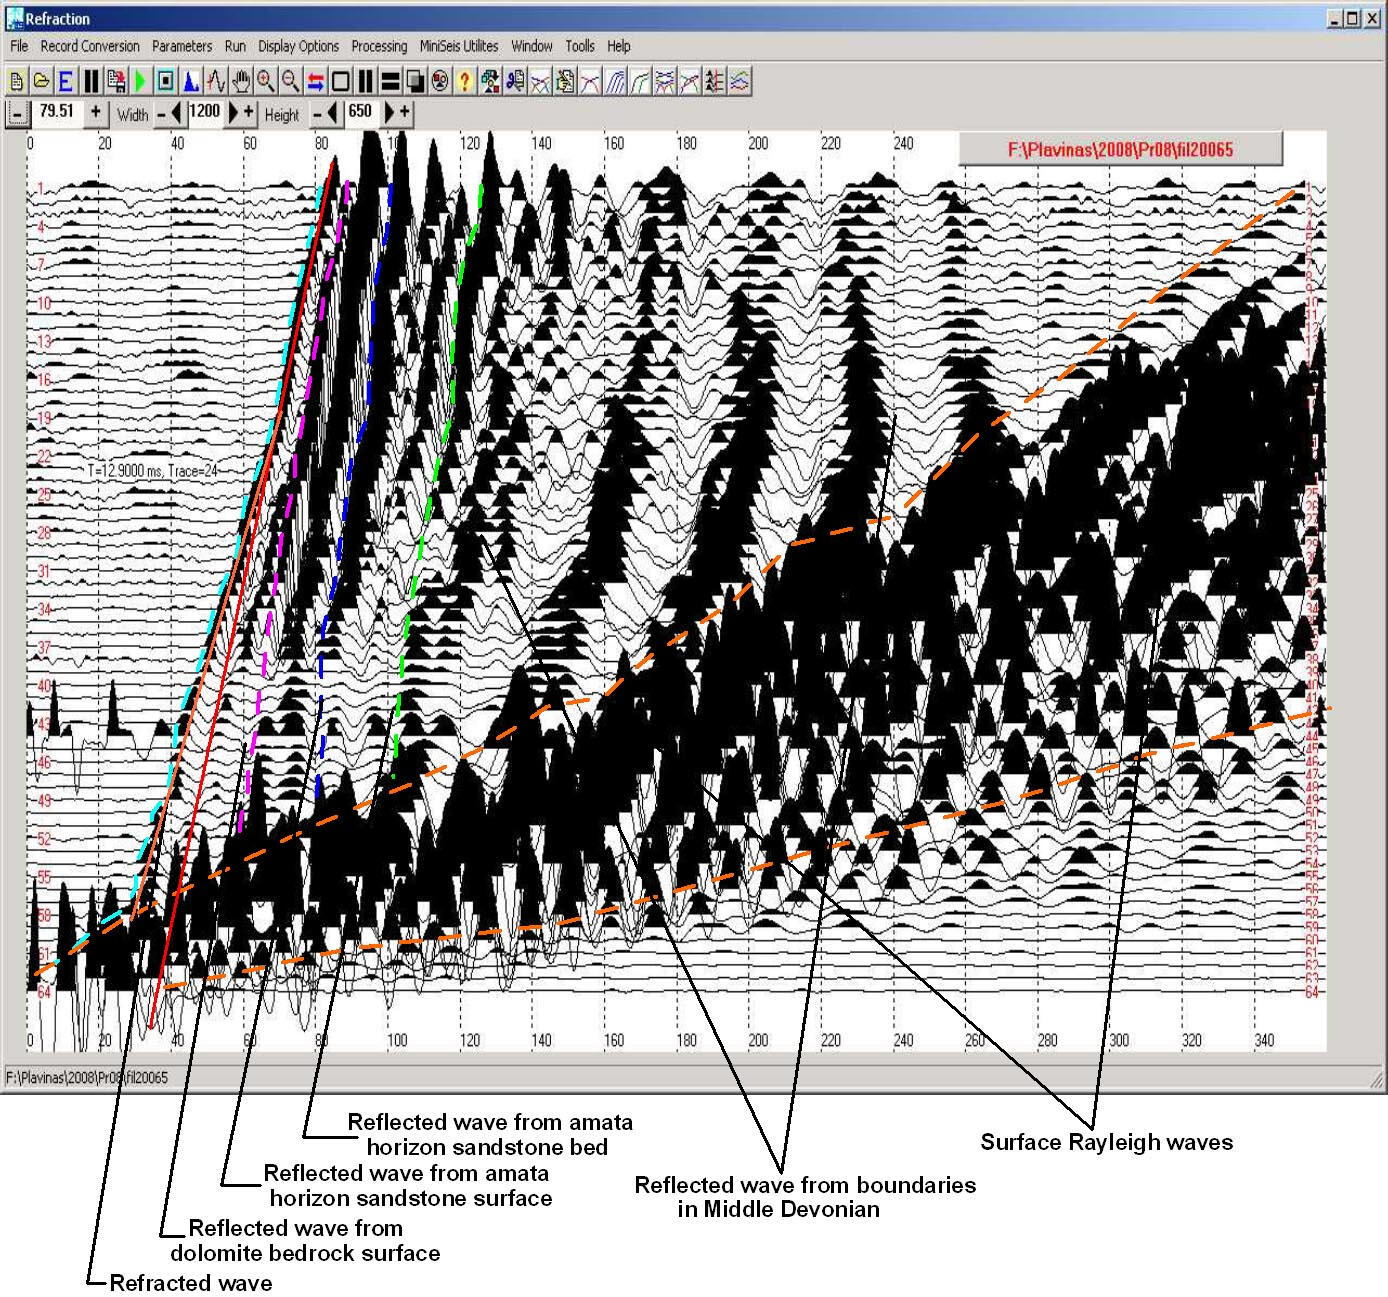
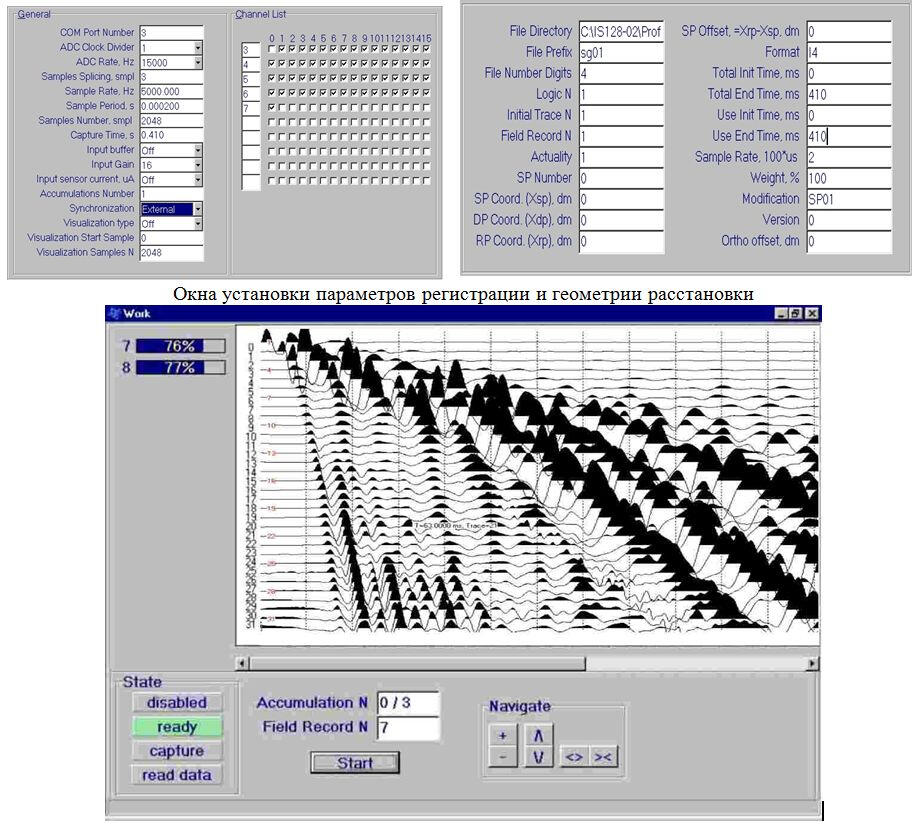
The service program runs in the Windows/XP-Windows-7/10 operating system environment. The test module of the program allows you to check the basic technical parameters of seismic recording channels, channel view and calculation of statistical characteristics of signals, perform spectral analysis of records.A set of window menus gives to the operator the ability easily and clearly set the parameters of registration and geometry of receivers placement.
The working window of the collection program displays a summary seismogram obtained after sending records from a set of remote modules, the charge level of the built-in batteries of remote modules, the number of the current excitation in the series of accumulations, the number of the current record and the process of passing signals. Using the scroll bar, you can view long records with the selected detail.When continuous seismic-acoustic profiling is performed, the multichannel seismogram from the previous excitation can optionally be displayed on the screen, or a time section along an arbitrary but predetermined channel of any hydrophone section. In addition, the number of the current record from the beginning of the profile and the coordinates obtained from the GPS receiver without hydrophone sections offsets are displayed.
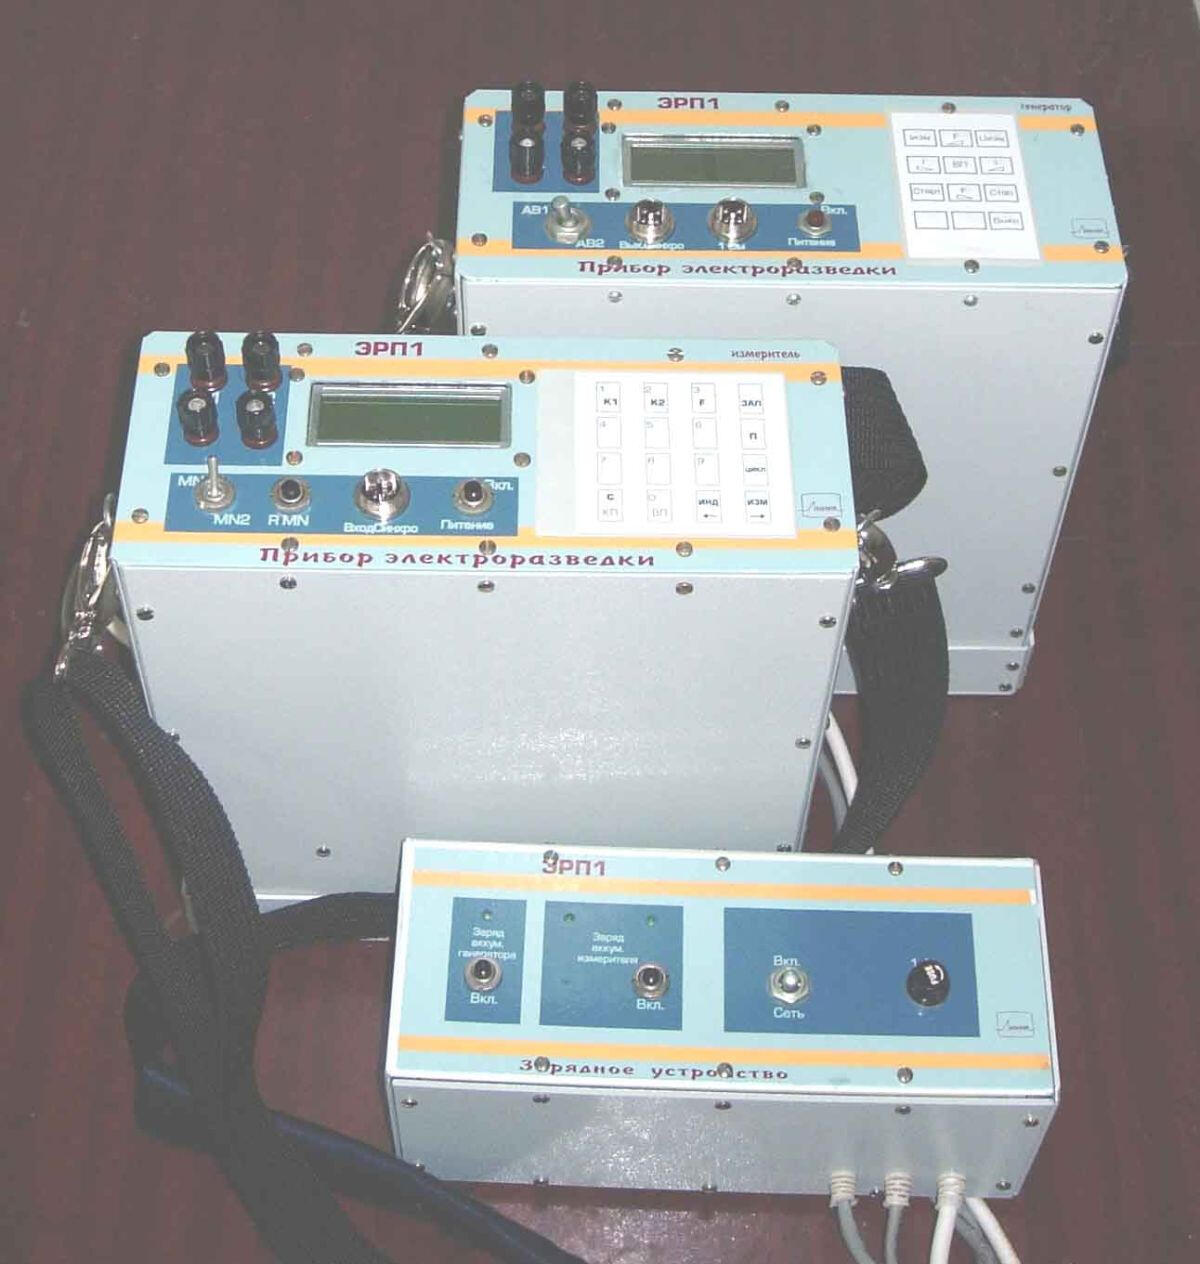
Low-frequency electrometry equipment ERP-1
(Manufacturer – MPP "Line", Sevastopol, Ukraine)
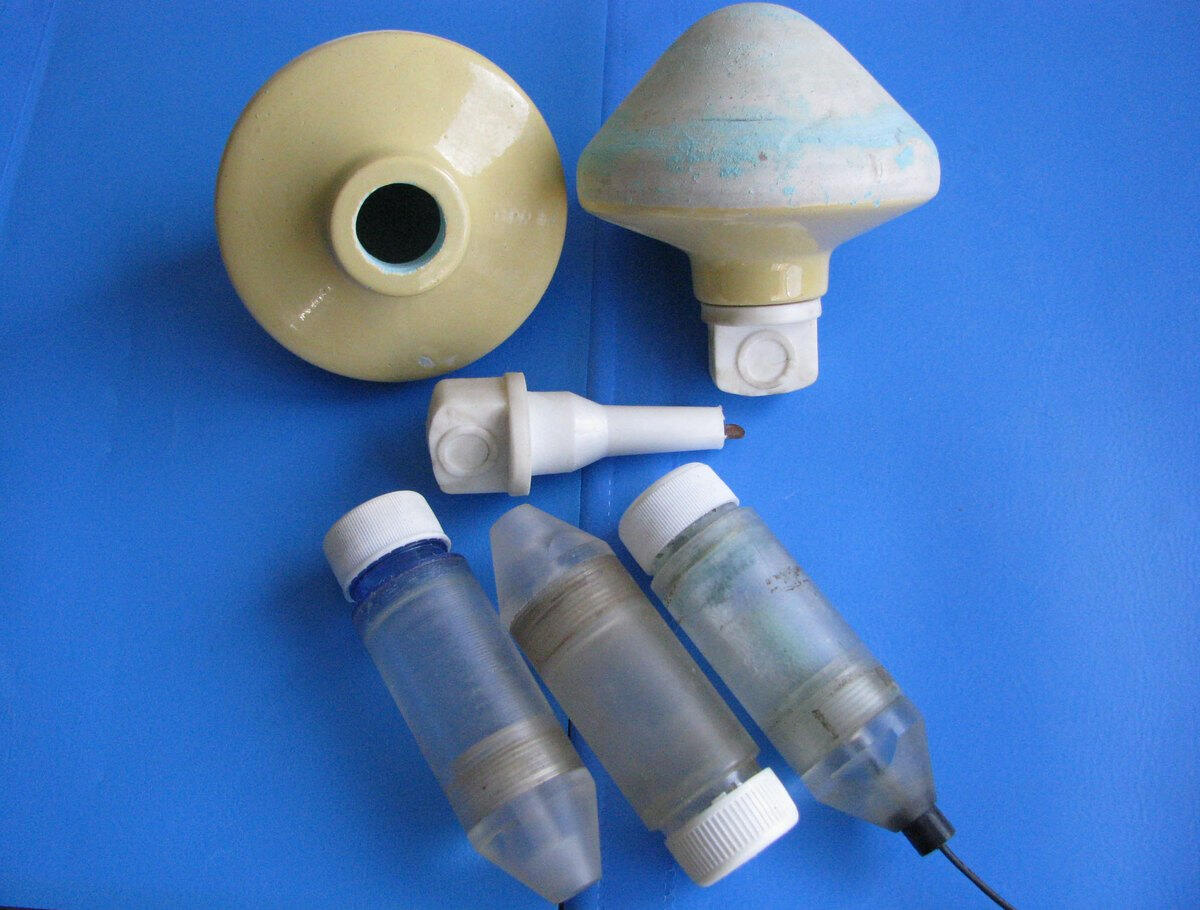
Non-polarizing electrodes for measurements on land and in water
Applications
Portable digital equipment ERP-1 is designed to perform geophysical observations methods:
- electrical prospecting by a resistance method by direct and alternating current (VES, EP, MG, MS, and the measurement of full vector of the electric field - vector survey)
- self potential method (SP)
- induced polarization method (IP)
Main specifications
Ambient temperature: from -30 up to + 40 C
Spray-protective and shock-protective design
Calibration of the internal source of test signal
Possibility of joint calibration of the generator and measuring unit by reference resistor
Equipment is designed with micro- controllers using and is managed via program
Generator and measuring unit synchronization is carried out via cable
Generator ERP-1
Maximal output voltage of 300 V
Maximal output power 30W
Output current shape - meander and DC
Operating frequencies: 0, 1.22, 2.44, 4.88 Hz
Output current 1, 2, 5, 10, 20, 50 and 100 mA
Output current stability - not worse than 1%
Supply voltage ~ 12 V (9.5 V minimum, 15.5 V maximum)
Weight (with batteries) 3.5-4.4 kg (depending on the battery)
The battery capacity - 2 Ah or 4 (according to customer's choice)
Possibility to use an external power supply with voltage of 12 V
Calibration voltage output from 1 Ohm resistor
Measuring unit ERP-1
Operating frequencies of 0, 1.22, 2.44, 4.88 Hz
Input impedance not less than 10 MOhm
Maximum input signal 5 V
The quality factor(Q-ratio) of the analog filter - 18
Interference 50 Hz dumping at least 80 dB
Own noise level not exceeding 0.2 µV
Sensitivity 1 µv
RS232C interface type
Built-in memory capacity 8 MB (up to 70 000 measurements)
Weight with batteries 3.2 kg
Backlight LCD display
.
.
Switch channels and cables for multi-electrode electrical tomography
Equipment kit includes also a mechanical switchboard of channel and multi-electrode cable set, allowing connection up to 48 electrodes to the generator output and to the measuring unit input without electrode installation changing. Multi-electrode cable consist of two sections with electrode step 5 m, that allows to implement alternating displacement of the sections along line, if it length exceed the length of an one installation.
High frequency kit for micro-VES MEGGER det4/5
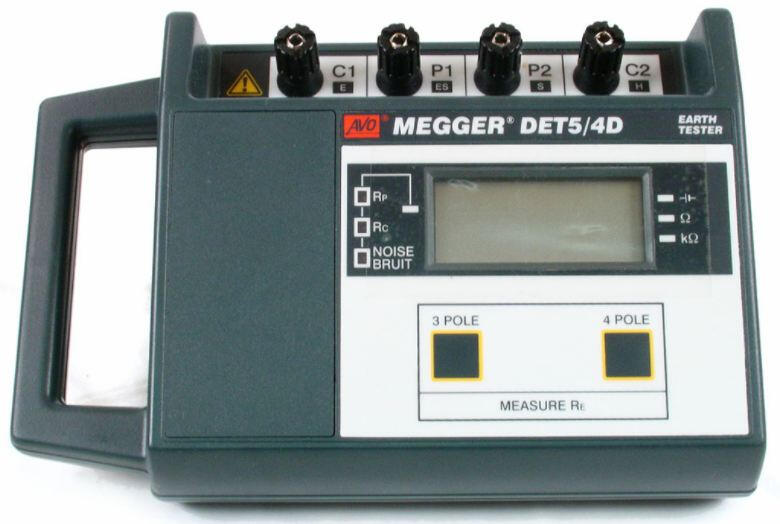
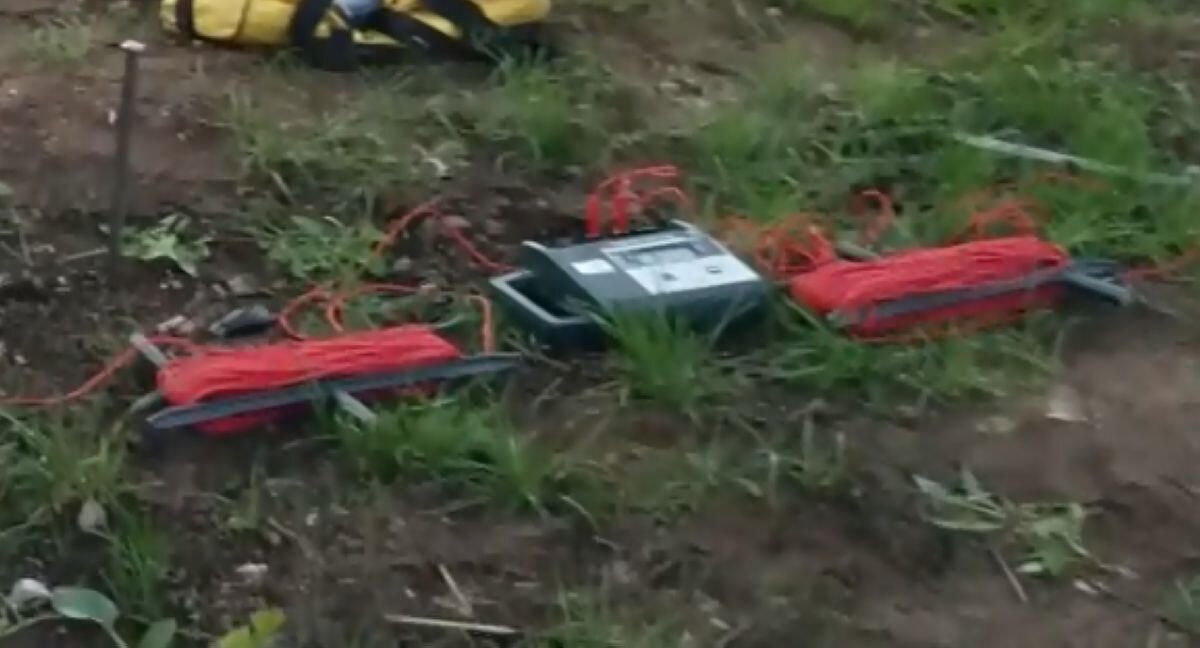
Technical specifications
The ranges of measured resistance of the soil
0.01 Ω-19.99 Ω
Ω 0,1 – 199,9 Ω
1 Ω – kΩ 1,999
10 Ω – kΩ 19,99
Measurement accuracy (23°C ±2°C)
±2 % of the read value of ±3 decimal digits. Total measurement error ±5% of read value ±3 decimal digits
Conformity to standards
BS 7430 (1992), BS 7671 (1992), NFC 15-100, VDE 0413 Part 7 (1982), IEC364
Measuring frequency
128 Hz ± 0.5 Hz
Measurement current value
The range of 20 Ω and 10 mA a.c. rms
Range 200 Ω 1 mA a.c. rms
The range of 2k Ω and 20k Ω 100 µA a.c. rms
Short – circuit current - constant in all ranges
Noise
Electrical interference with a peak voltage of 40 V at frequencies 50 Hz, 60Hz, 200 Hz or 16 2/3 Hz potential current causes an error of ±1% of the read value in the range 20 Ω - 2 kΩ. If the noise indicator does not give indications, the maximum error of the interfering voltage in these ranges does not exceed ±2%. In the range of 20 kΩ this error is reduced to a peak voltage of 32V.
Maximum ground resistance current
The ground resistance, which gives an additional error 1%:
The range of 20 Ω - 4 kΩ
Range 200 Ω - 40 kΩ
The range of 2kΩ and 20kΩ - 400 kΩ
This is resistance of grounding devices, but measured resistances should be subtracted from these values. If the Rc indicator does not give readings, the maximum error will not exceed 2% of maximal resistance of the potential electrode
The maximum output voltage of 50 V
Protection against external voltage
Supply
Built-in 12V rechargeable battery
LMS-337C DF echo sounder
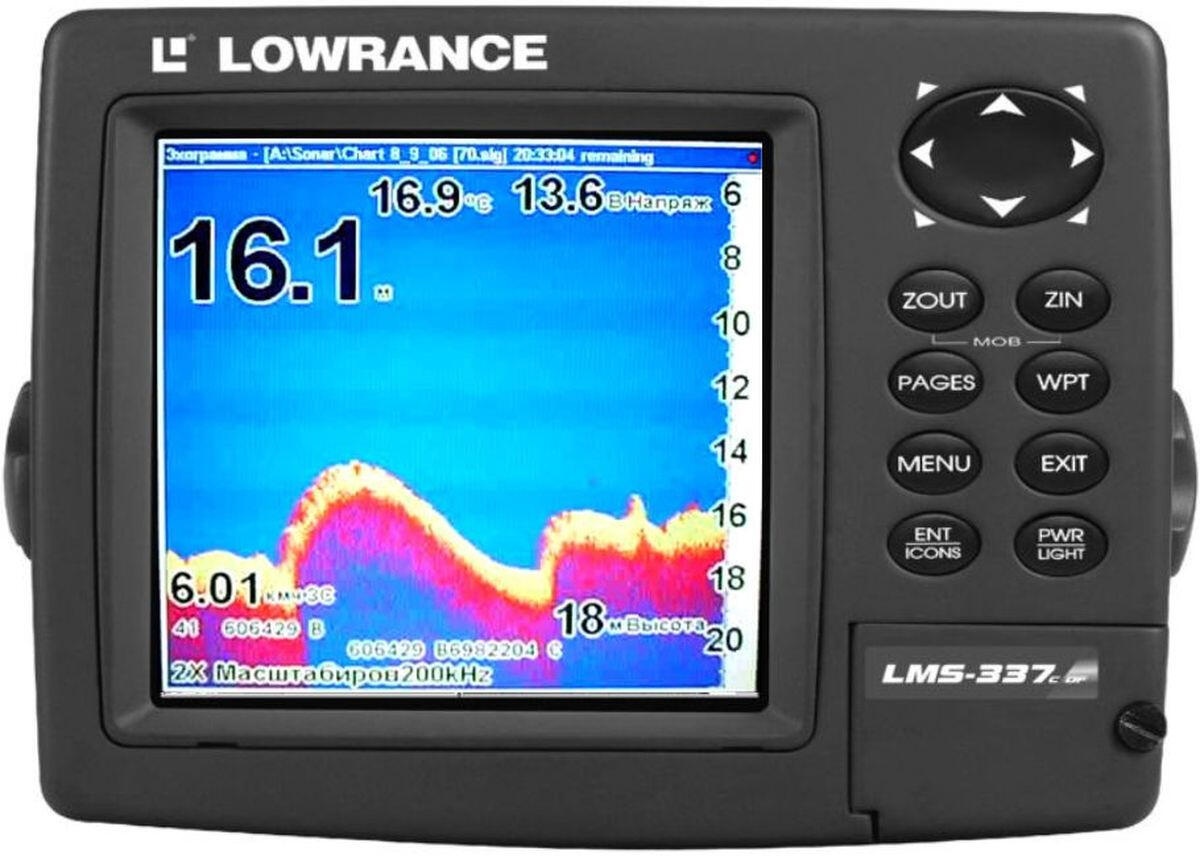
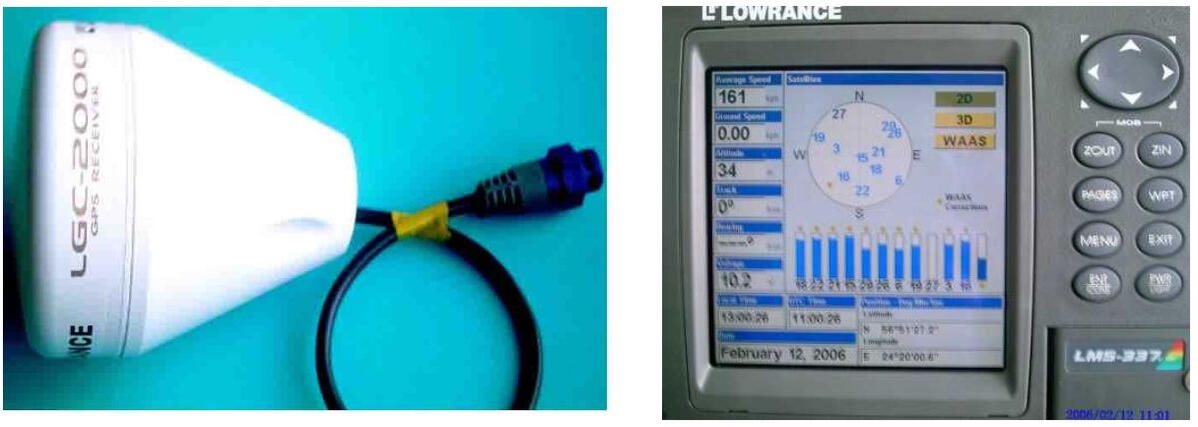
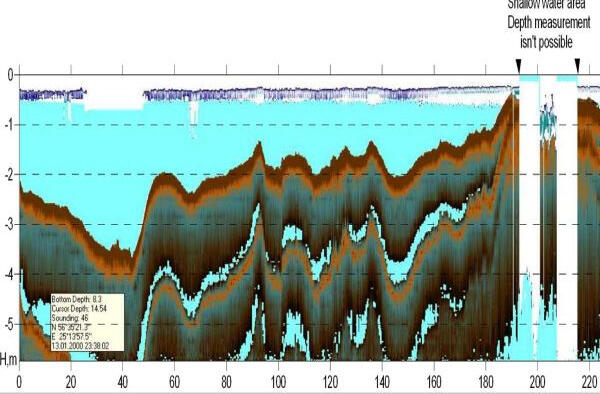
Applications
LMS-337C – compact dual frequency echo sounder with a color LCD screen for installation on small boats. Used as a navigation aid for operational control of the depth and sounding works in conditions of shallow and coastal sites. The screen displays in graphical form the bottom topography and samples of the depths and of the plane coordinates obtained from a GPS receiver.
Transducer HS-50/200-DX
Instantaneous power
2400 watts at a frequency of 200 kHz
3000 W at a frequency of 50 kHz
Average (distributed) power of 375 W
Navigation and positioning
• The LGC-2000 sounder GPS antenna with built-in differential correction receiver from satellite service system WAAS and a navigation panel with a display of signal amplitude from active satellites
Brief technical specifications of LMS-337C:
• measuring range-0.75 m-762 m;
• digital data recording;
• built-in water temperature sensor;
• frequency range-50 kHz, 200 kHz or both simultaneously;
• peak power 3000W;
• average (distributed) output power of 375 W;
• supply voltage 10-15 VDC;
• supply current 600 mA, 700 mA with GPS;
• input / output interface protocol NMEA-2000, NMEA 0183;
• update period of 1 sec;
• amount of graphic images recording of the scan on a flash card up to 1GB;
• dimensions 13.8 x 17.6 x 8.6 cm;
• 5” (12.7 cm) color screen, 480x480 pixels resolution;
• image zoom in x2 or x4 selectable from the menu;
• six depth ranges selectable from the menu;
• HS-50/200-DX two-frequency transducer
• width of the directional characteristic (at -3 dB) 35° (50 kHz), 12° (200 kHz);
• GPS-12-channel receiver LGC-2000 with external antenna;
• differential corrections receiving from the geostationary satellite for WAAS;
• operating temperature range -10°C- + 55°C.
Three dimensional (3D) geophones for soil and foundations vibrations measurements
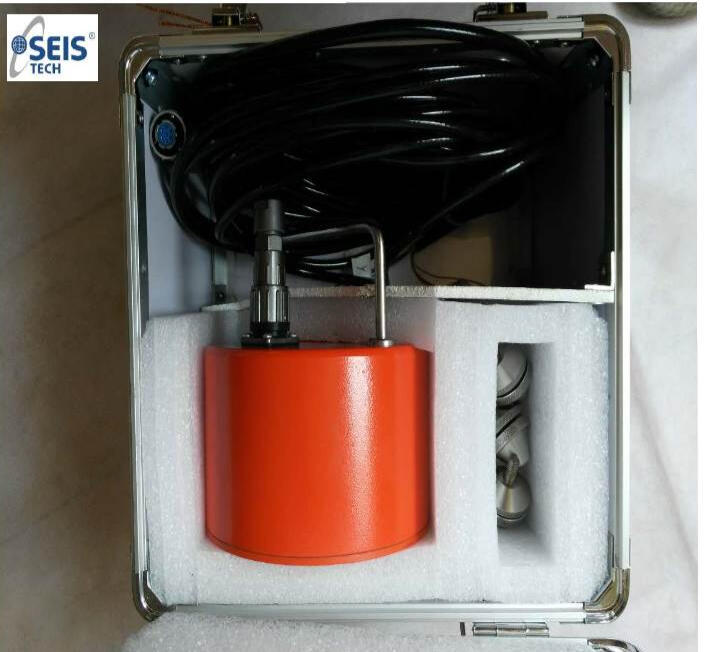
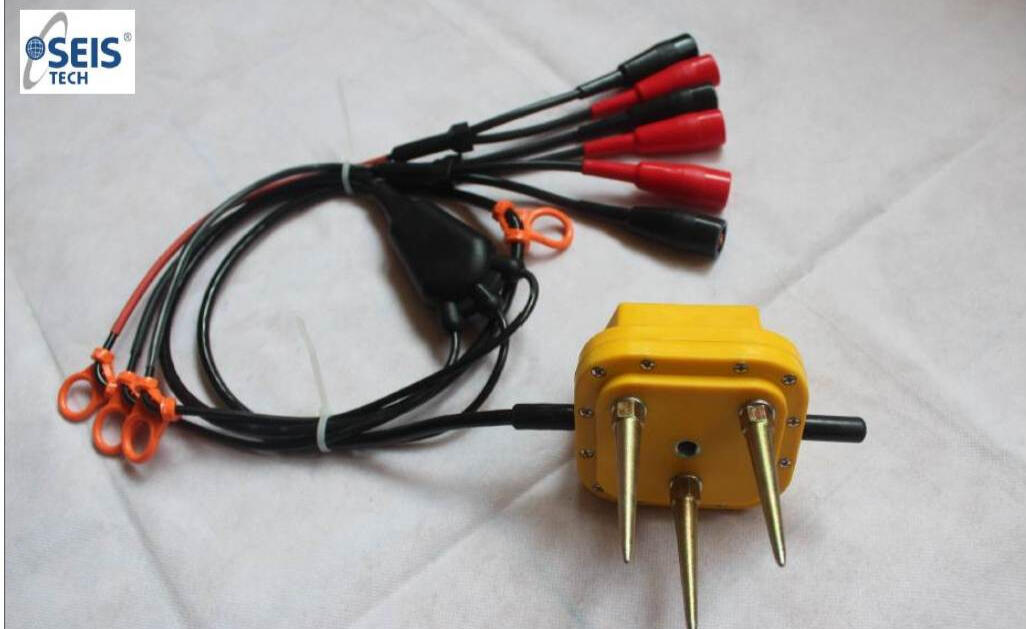
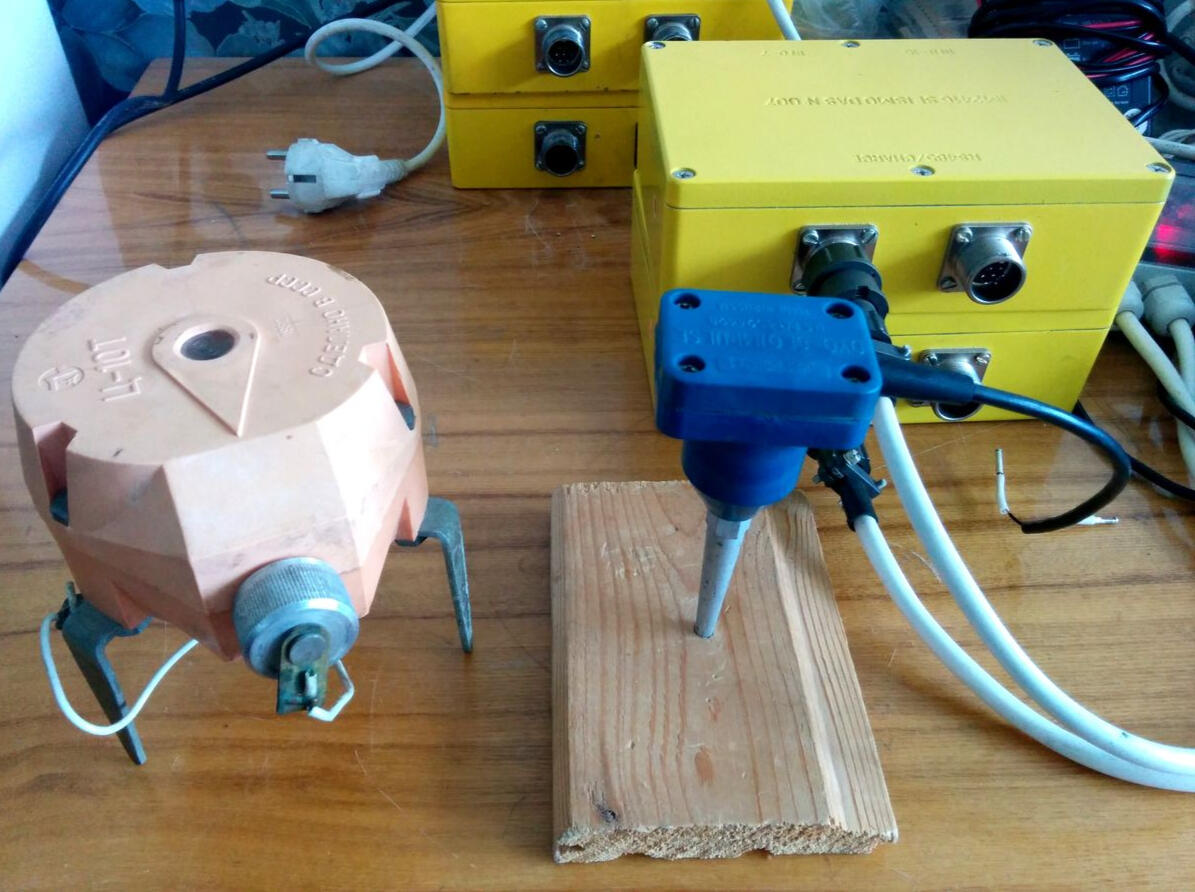
Geophone Type: ST-4.5Hz 3D
ST series Three Dimensional (3D) Geophone is a type of electromechanical conversion device. Inside of the 3D geophone, three mutually perpendicular geophone elements are arranged in Cartesian coordinates, which means that the vertical geophone element is Z direction, the east direction horizontal geophone element is X direction, and the north direction horizontal geophone element is Y direction, by which the Seismic signals in the three directions of X, Y and Z will be taken simultaneously and converted into electrical signal outputs.ST Series 3D geophones are fully compatible with deep seismographs in deep seismic exploration. Also they are the ideal choice for natural earthquake prediction and detection, pulsating micro seismic measurement of bridges& highways, and other applications of low frequency seismic investigations.
- High sensitivity, low distortion, good consistency, good linear response, and reasonable damping coefficient.
- Rugged structure, good sealing and excellent waterproof performance.
- Horizontal adjustment device and direction indicator equipped.
- Waterproof Metal Case, 3Nos. of Adjusting Screws, 7-Pin Socket and 1.5meters of leading out cable are also equipped.- Three Dimensional Geophone Type: ST-4.5Hz 3D and ST-4.5Hz 3C are available.
Geophone Type: ST-4.5Hz 3C (ST-4.4N)
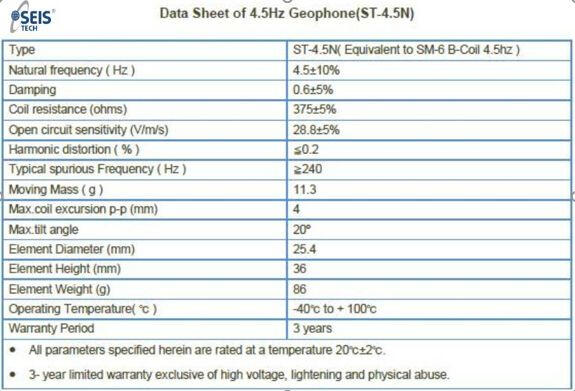
Geophones Ц10-Т and GS-20 DX OYO
In addition, 3-component geophones Ц-10Т and vertical geophones GS20 DX OYO Geospafce with a natural resonance frequency of 10 Hz are used to study the physical properties of the massif of soil and rock at the points of measurement of vibrations and the conditions of propagation of elastic oscillations along selected directions in the field.
Objects of investigations
Soil investigation at the sports arena construction site
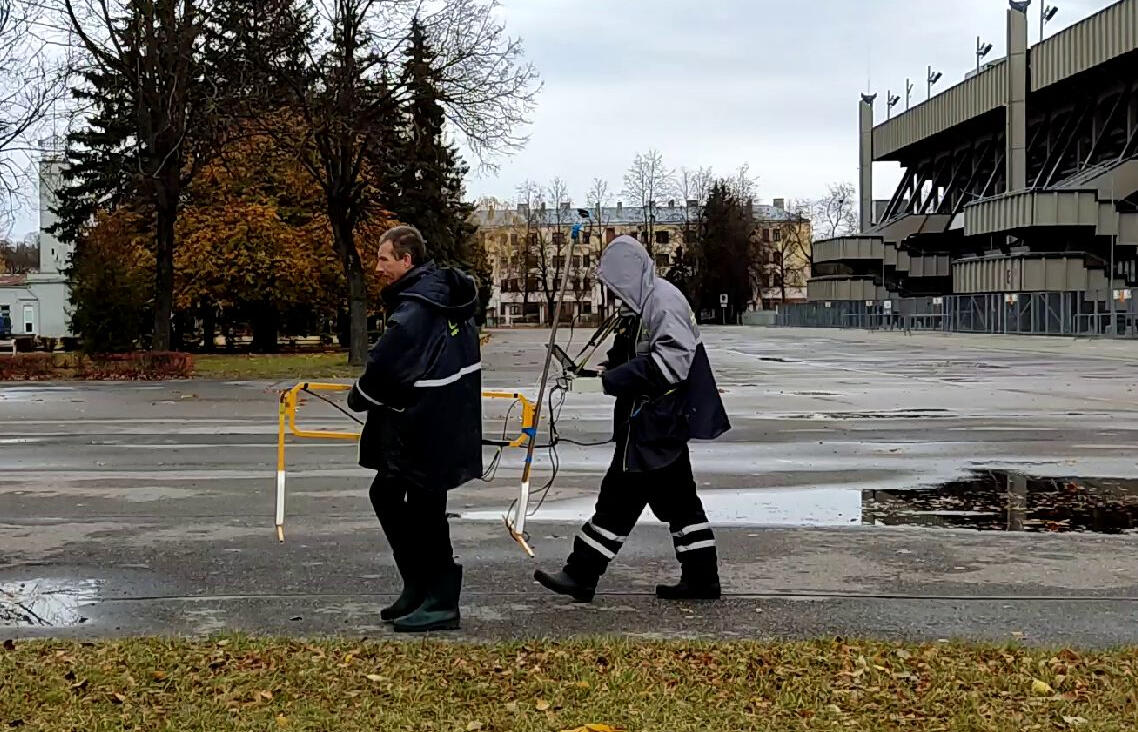
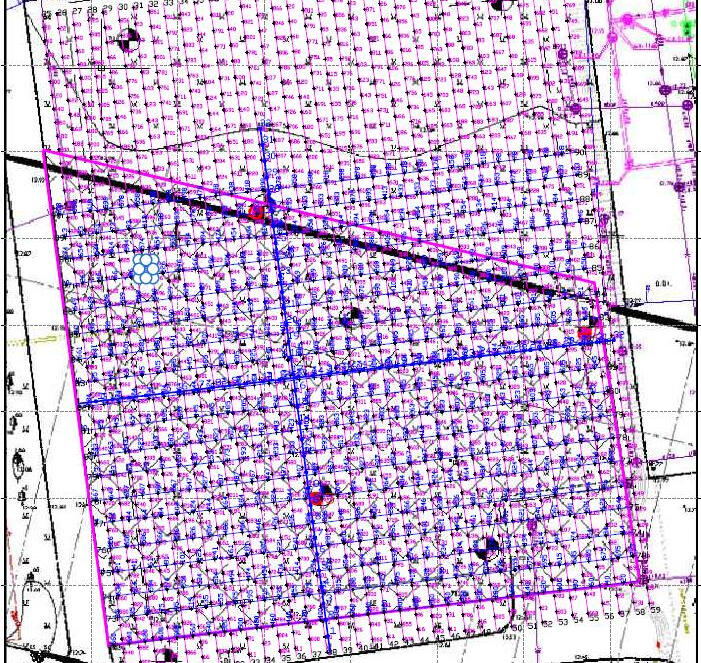
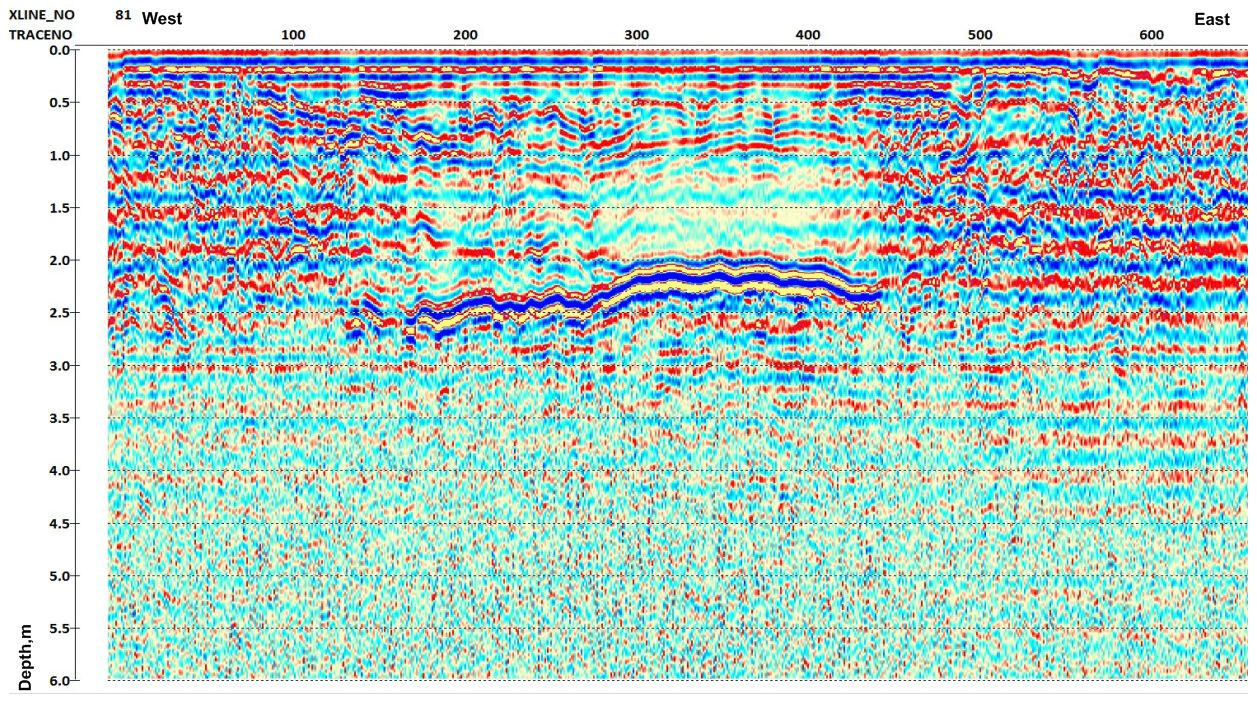
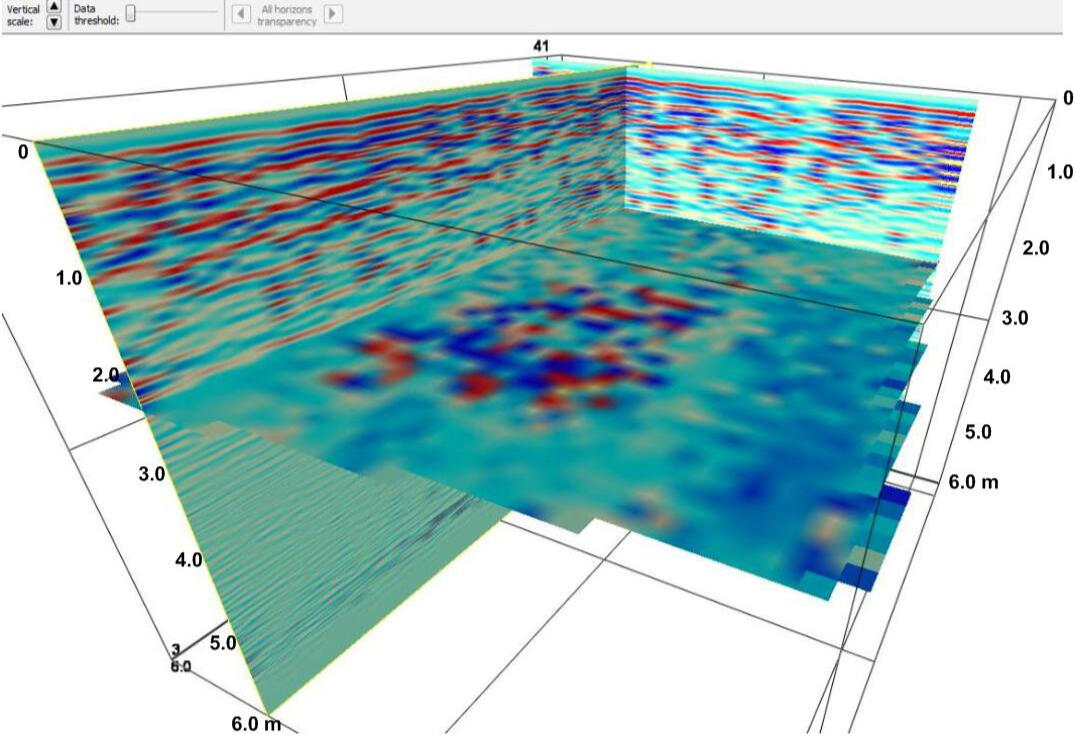
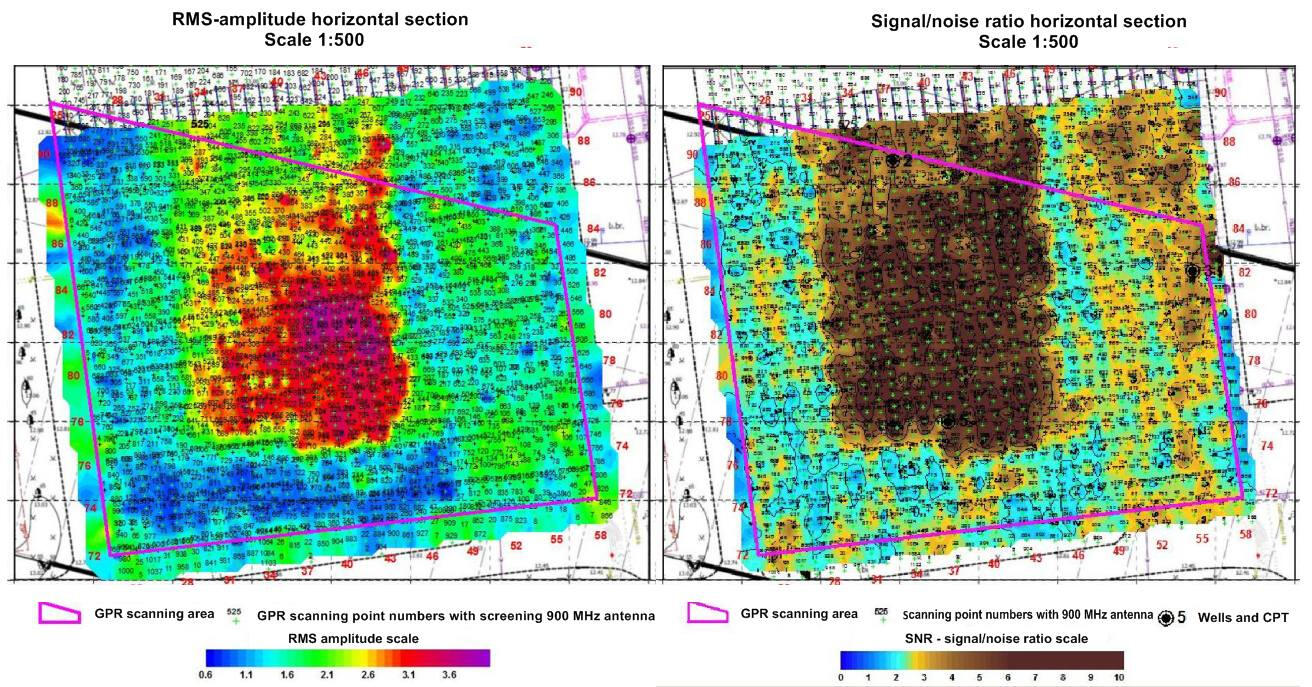
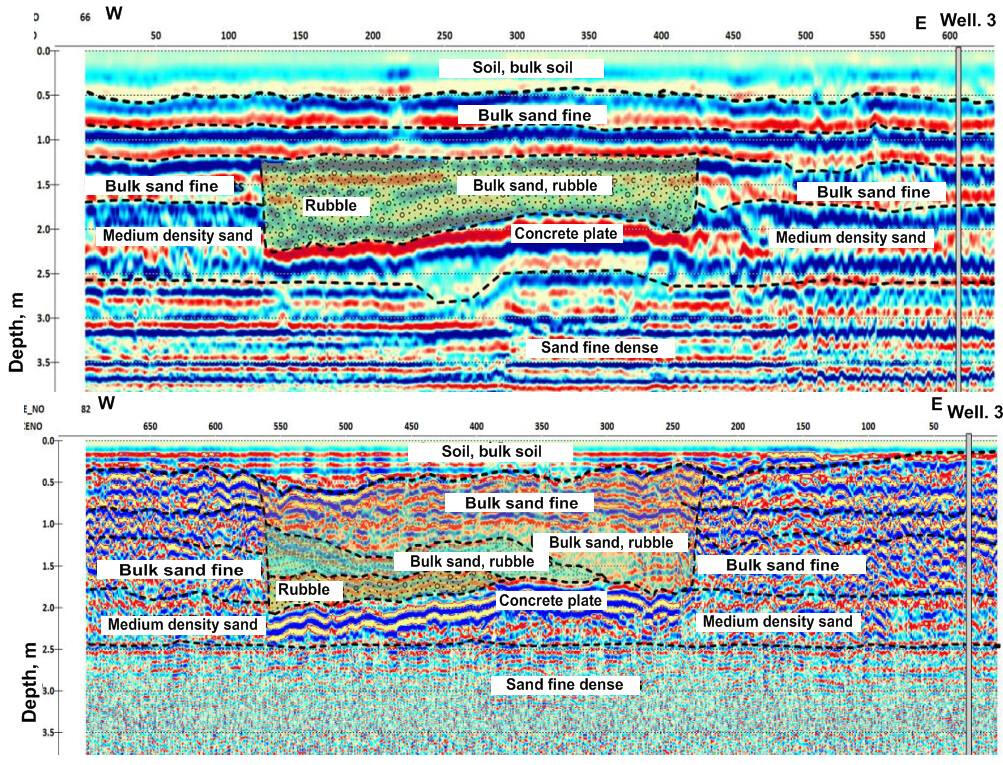
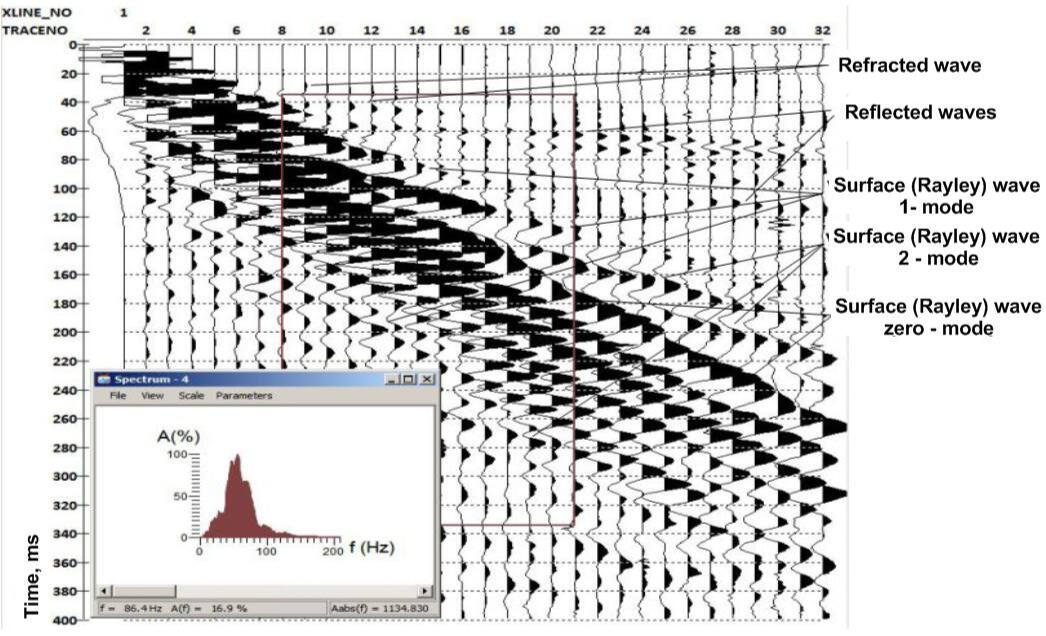
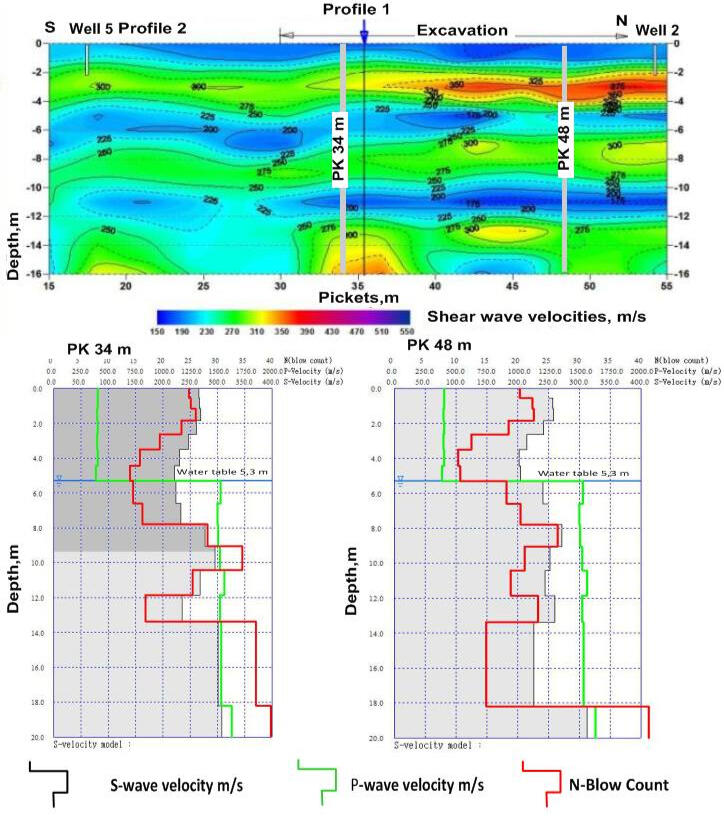
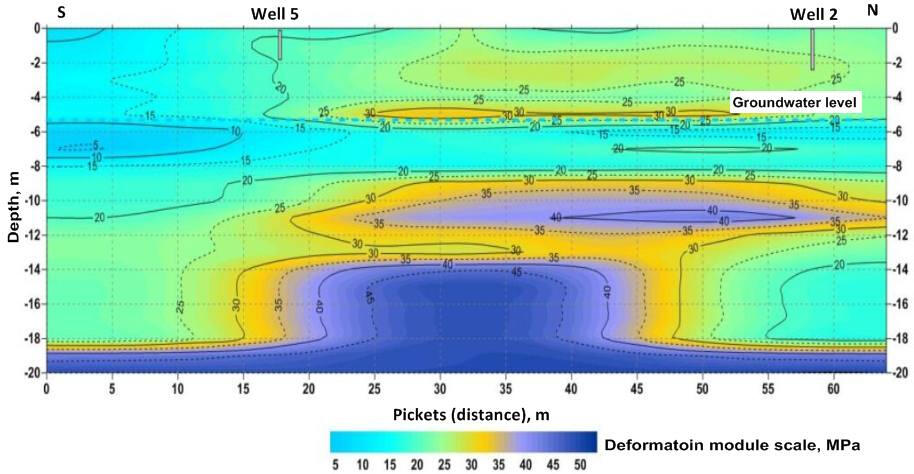
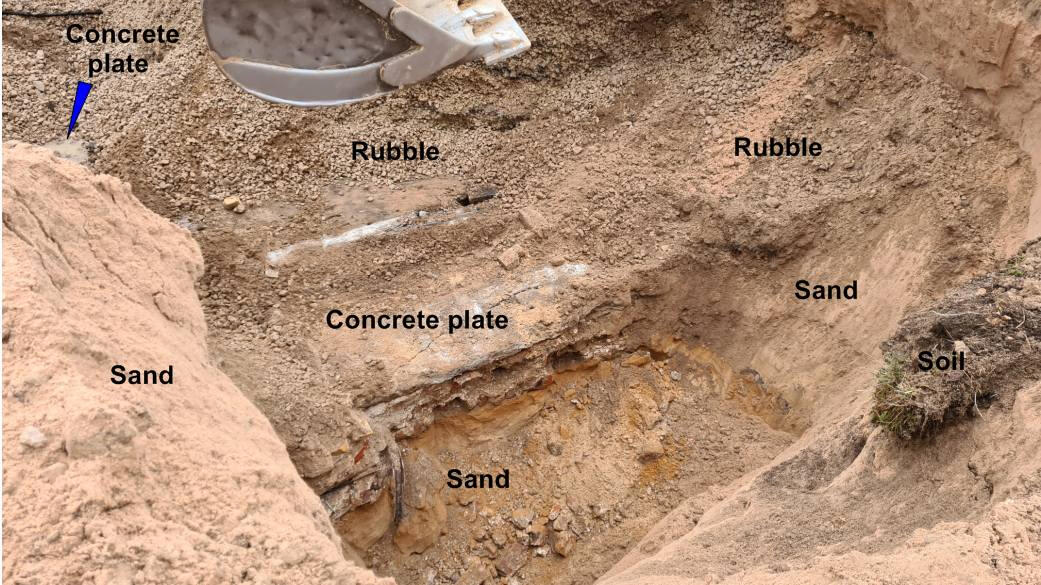
Ground penetrating radar profiling using a 150 MHz low-frequency dipole antenna with an LS2303x-G GPS receiver
During construction work, the problem of localizing the remains of foundations of former structures in soil foundations often arises. This task is especially relevant when designing pile foundations without preparing the corresponding pits at the construction site. Often, when demolishing old buildings, it is not possible to completely remove deep massive parts of old foundations.When performing profiling work with low-frequency 150-75 MHz ground penetrating radar antennas, the recording interval is 200-300 ns, which corresponds to a probing depth of 10-17 m in a probed medium represented by water-saturated sand with an average permittivity of 15-16. Signal amplification at the beginning and end of the recording is 12/54 dB. A soft bandpass filter was used during recording. The total number of implementations for one track is 4-8.
Place of work. Scheme of ground penetrating radar profiles
The study was performed in the following volume:
- dipole antenna with an operating frequency of the emitted pulse of 75 MHz, the number of performed profiles is 12, the total length is 720 m,
- dipole antenna with an operating frequency of the emitted pulse of 150 MHz, the number of performed profiles is 23, the total length is 1380 m,
- shielded antenna with an operating frequency of the emitted pulse of 900 MHz, the number of profiles is 66, the total length is 3960 m.
.
.
Example of processing a ground penetrating radar profile obtained with a shielded antenna of 900 MHz, using the RadExPro software package.
Most concrete residues in soils have very contrasting physical properties in relation to the enclosing soils. Their surfaces are boundaries where sharp changes in acoustic and electromagnetic resistance occur, which allows them to be mapped using seismoacoustic and ground penetrating radar sounding methods.
Representation of local heterogeneities in a cube of georadar data
A set of orthogonal profiles developed on a fairly dense grid with a step of 2-3 m allows combining two-dimensional sections into a cube of georadar data. In this case, cubes of various transformations of the reflected signal, cubes of the so-called dynamic attributes - instantaneous amplitude, dominant frequency, signal-to-noise ratio, etc. can be obtained.
Horizontal sections at a depth of 2 m of the cube of attributes of the reflected GPR signal: RMS amplitudes (left) and signal-to-noise ratio.
The contours of the object in the plan were determined based on the analysis of horizontal sections of the cube of GPR data. The amplitudes of the reflected electromagnetic pulse in the data cube were preliminarily transformed into various dynamic attributes - signal characteristics, such as instantaneous and peak amplitudes, prevailing frequencies, signal-to-noise ratio, etc. Fig. 4 shows the sections of RMS amplitudes and signal-to-noise ratio at a depth of 2 m.The choice of the average depth of the section and the width of the signal processing window have a great impact on the appearance of the sections. Thus, in the section of RMS amplitudes, the contours of the object have a jagged character, and the parameter value itself decreases sharply in the northern part of the object, which is associated with the immersion of the reflecting boundary and its deviation beyond the signal processing window along the horizontal plane. The contours of the rectangular object are most clearly visible in the signal-to-noise ratio parameter section. The object measures 60x32 m within the GPR scanning area and quite possibly extends beyond its northern boundary. Since it was impossible to continue drilling deeper than 1.8-2.0 m in two geotechnical boreholes located within the contour of the identified object, it was natural to assume that the object was a large fragment of the concrete floor of the basement left in the ground after the dismantling of the old ice arena building.
Interpretation of the structure of the pit filling soils based on GPR sections of different frequencies.
The fact that the host soil massif is heterogeneous is evidenced by the large number of reflecting boundaries of complex shape in the depth range of up to 2 m. This is especially noticeable in sections obtained using a high-frequency 900 MHz antenna. The most effective interpretation from the point of view of studying the structure of the soil massif is using reference geotechnical boreholes. In this case, it is possible to correlate the reflecting horizons in the sections with the boundaries in the lithological columns of the wells. On the other hand, the sections more convincingly distinguish layers and lenses of soils of different compositions. And based on the composition of the soil, a certain correction of the propagation speed of electromagnetic waves is possible and, accordingly, clarification of the depth of the underground object
Processing shallow seismic exploration data
To clarify the characteristics of the objects identified by the ground penetrating radar, additional measurements were required using the seismic exploration method along individual lines. This method allows you to estimate the propagation speed of elastic waves in the soil massif and determine the density of the identified objects. The profiles were made using a telemetry data collection system based on remote seismic modules IM2416 and a 32-channel geophone installation. The recording duration was 2000 discretizations for each channel with a sampling period of 500 μs, the recording time was 1 second. Seismic pulses were generated by striking a steel plate on the soil surface with a sledgehammer weighing 8 kg.
Interpretation of Rayleigh surface wave records
Processing seismic records in the RadExPro package using the MASW (Multichannel Analysis Surface Waves) method allows us to estimate the propagation velocity of shear waves. An example of MASW processing is shown in the figure (left).The following figure shows two-dimensional (2D) sections of shear wave propagation velocities. These sections show a more clearly defined layered structure of the soil mass. Although the general nature of the transverse velocity distribution and the absolute values of the Vs velocities obtained using these programs are close to each other. In addition, in the section within the pit identified using ground penetrating radar data, at a depth of about 2.0 m, a layer of increased Vs velocity with a thickness of 1-1.5 m, represented by sand and crushed gravel, is more clearly distinguished.The figures below show examples of the dependences of the calculated N on the velocities of transverse (Vs) and longitudinal waves (Vp) at the ends of profiles 1 and 2. It should be borne in mind that the Vp velocity graphs in this case are also calculated based on the initial Vs velocity graphs. They are calculated taking into account the introduced groundwater level at a depth of 5.3 m and have a sharp jump at the boundary of complete water saturation. In the upper part of the soil massif to the groundwater level, the Vp velocities have low values in the range of 300-400 m/s, sometimes comparable with the Vs velocities.
.
Example of a section of the total deformation modulus of fill soil and a Quaternary sedimentary massif.
To interpret seismic profiling data based on longitudinal and transverse wave velocity sections, predicted geomechanical soil parameters were calculated.The obtained data on the propagation velocities of longitudinal and transverse waves make it possible to obtain integral characteristics of the elastic parameters of the soil massif and provide a significantly greater depth of research.
Confirmation of the detection of an object in the soil as a result of subsequent opening
Subsequent excavations confirmed the presence of a concrete slab with the remains of utilities at the specified depths, as well as a different composition of the ballast soil filling the pit, from sand to a sand-crushed stone mixture with different-sized fragments. This allowed a more reasonable choice of the type and configuration of the foundation for new construction in the study area.
Dzirnavu Pond (Gulbene, Latvia)
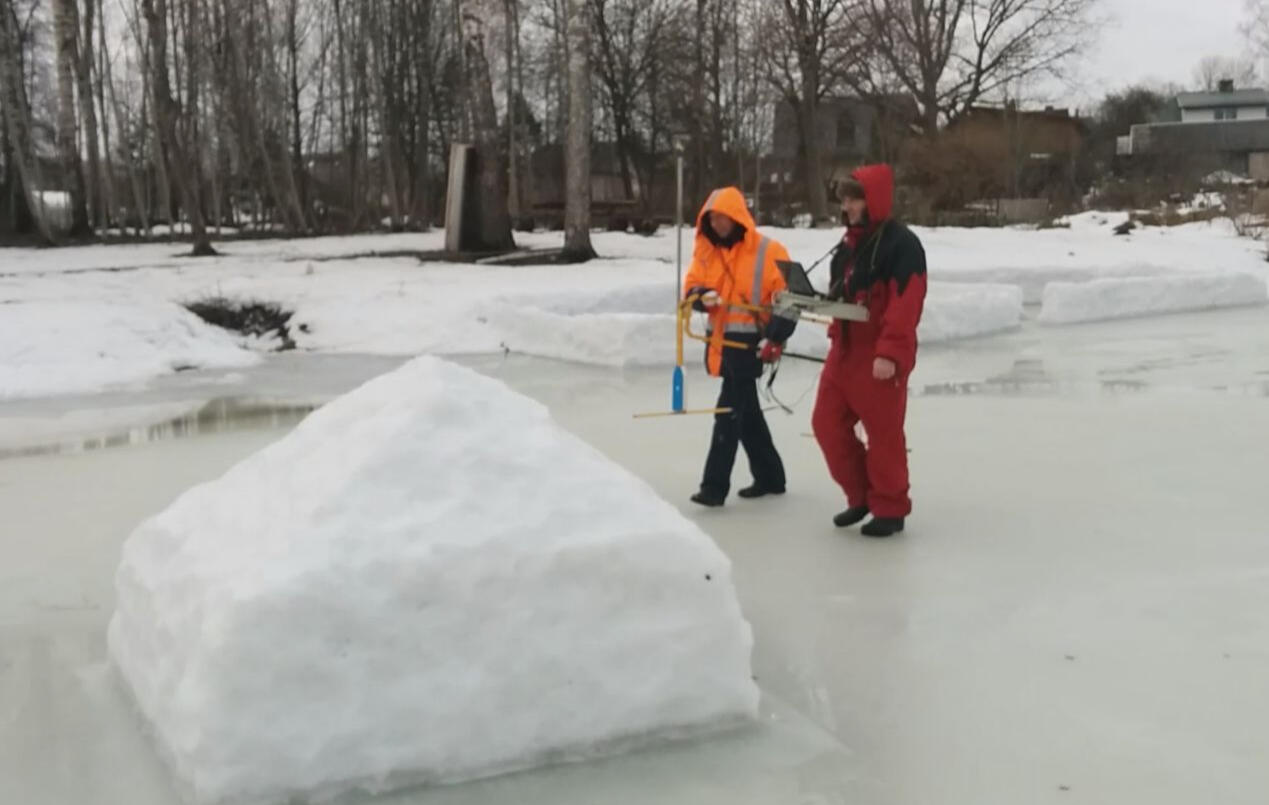
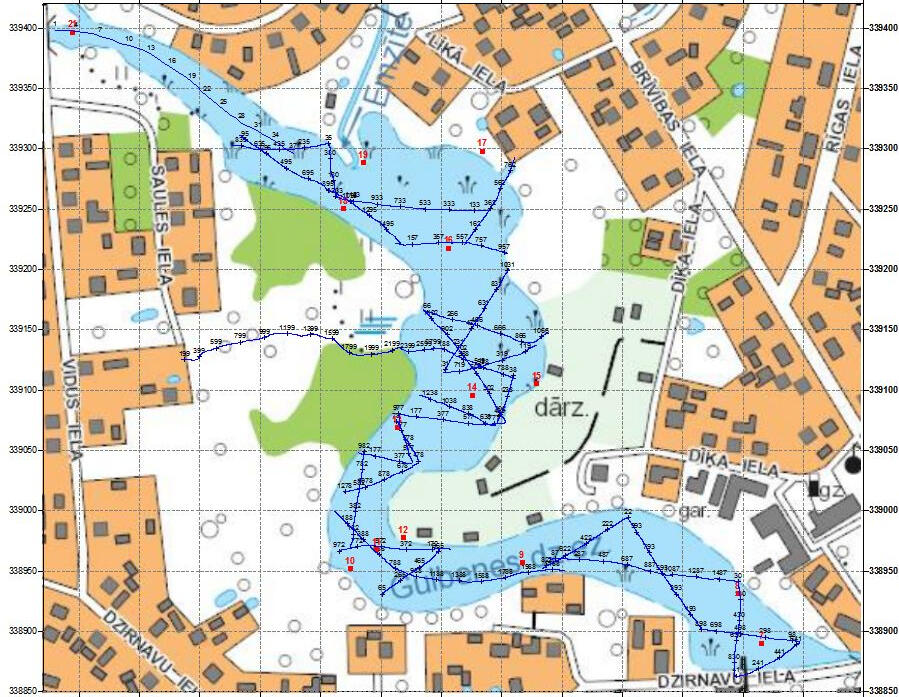
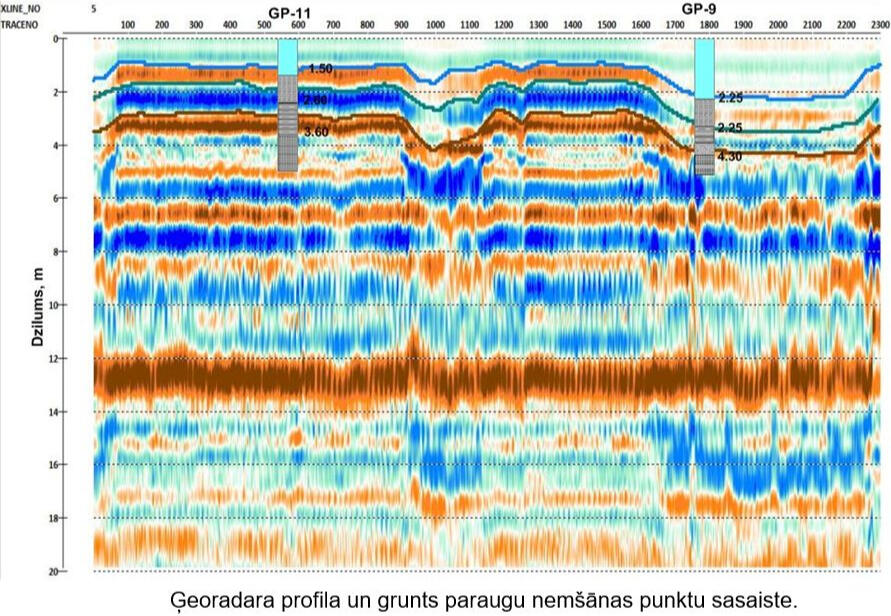
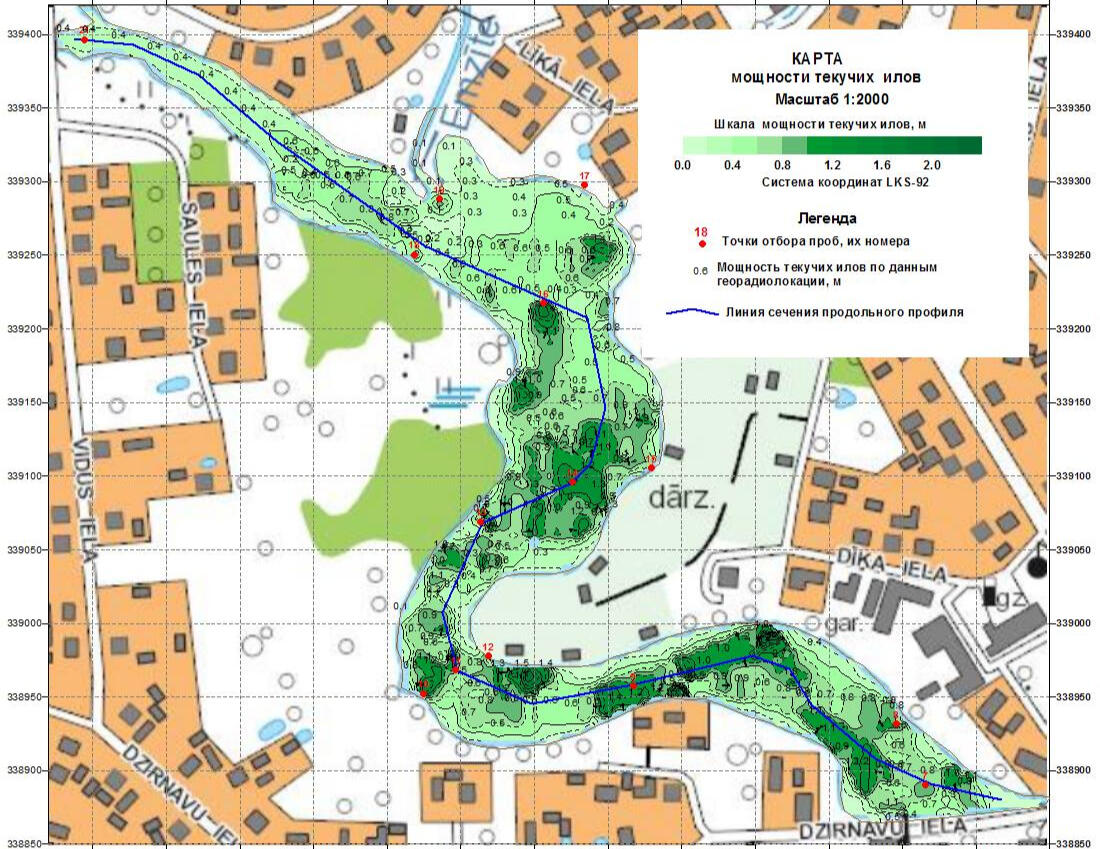
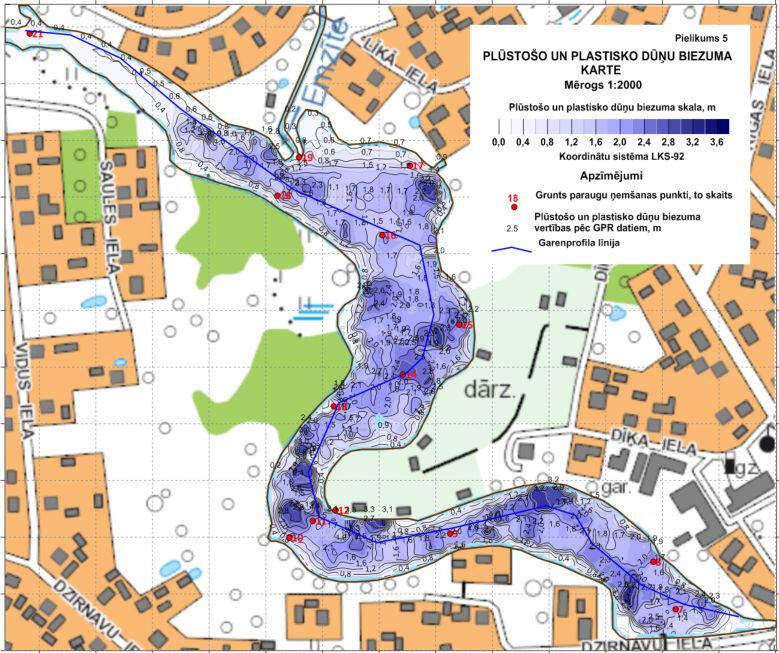
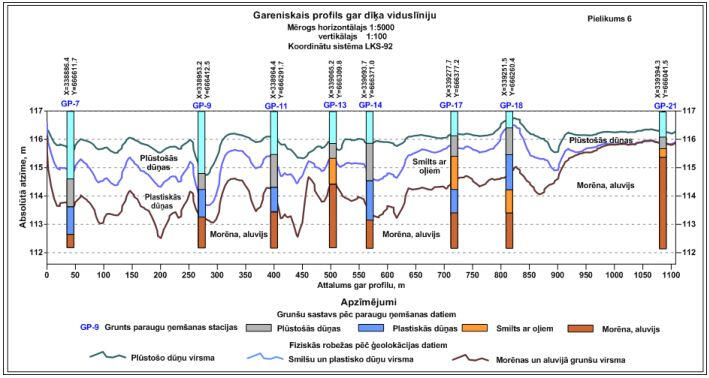
Ground penetrating radar profiling using a 150 MHz dipole antenna with a LS2303x-G GPS receiver.
Ground penetrating radar profiling to determine the depth of the alluvial and moraine soil surface and to assess the thickness of the overlying silt in the Dzirnavu pond in Gulbene was carried out from ice in areas with a safe ice thickness and no surface water.Due to the presence of water on the ice surface in some areas of the pond, and also taking into account the expected shallow penetration depth of the probing electromagnetic pulse, probing was carried out using a low-frequency non-contact dipole ground penetrating radar antenna with a probing pulse frequency of 150 MHz. The depth of the ice, water, silt and soil thickness studies was about 15-20 m.
Scheme of the completed profiles
The probing was carried out along 27 profiles, the total length of which was about 2500 m. The density of the grid of arbitrarily oriented profiles made it possible to construct maps of the silt surface structure and underlying dense soils.The profiles were located in the pond water area, which was covered with ice 25-30 cm thick during the studies. In some places, there was a 5-10 cm thick water layer on the ice surface, so the profiles were actually developed in accessible places along an arbitrary grid, if possible through the sampling sites of the bottom soils.When performing profiling work with a low-frequency dipole antenna at a frequency of 150 MHz, the recording interval was 300 ns, which corresponds to a probing depth of 18-20 m. The signal gain at the beginning and end of the recording was 12/36 dB. A hard bandpass filter was used for recording. The total number of realizations for one track is 4.
Example of processing a ground penetrating radar profile using the RadExPro software package
According to the methodological recommendations for radar probing, the value of the permittivity of the studied environment is 3-5. Data processing determined that the permeability value should be approximately 3.5, which corresponds to ice, contaminated water, fluid and plastic silt, and water-saturated sand.Special measurements of the propagation speed of the electromagnetic wave were not carried out in the work area. As a criterion for assessing the value of the permittivity, which determines the propagation speed of the electromagnetic wave, records of reflections coming from the surface of fluid silt, from the boundary between fluid silt and plastic mineral silt, as well as from the surface of alluvial and moraine deposits were used. In order to obtain a more accurate correlation of the depth of the monitored reflectors with the lithological boundaries between different soil types collected at the sampling sites, they were compared using a set of ground penetrating radar profiles and placed near the sampling sites. An example of such a comparison is shown in the figure on the left. It can be seen from this figure that in the area of the GP-9 point, where the bottom depth exceeds 2 m, there is a fairly good coincidence of the reflection phases with the lithological boundaries.
Map of the thickness of the fluid silt layer
A joint analysis of the sampling data and the ground penetrating radar section in the lower part of the pond basin revealed three reflectors that are fairly regularly correlated with each other throughout the study area. They are confined, respectively, to the surface of fluid silts, the boundary of fluid and plastic mineral silts, and the surface of alluvial and moraine soils. The results of the immersion depth along these reflectors were entered into the database.Using the database, 3 corresponding surface maps and thickness maps of fluid and plastic mineral silts were constructed. The maps show the position of the longitudinal profile along the pond axis.
.
Map of the total thickness of the layers of fluid and plastic silt
Based on the results of probing, reflecting boundaries in the silt thickness and the lower boundary of their distribution were traced. An assessment of the total volume of silts in the pond water area was carried out, as well as an assessment of the volumes of the upper layer of weak fluid silt and the lower layer of plastic mineral silt.
Longitudinal profile along the middle line of the pond.
The calculated section for this profile was obtained on a horizontal scale of 1:5000 and a vertical scale of 1:100. The position of the reflecting boundaries on this profile is shown taking into account the absolute mark of the ice surface +117.00 m.
Reconstruction site of the Olaine oil depot
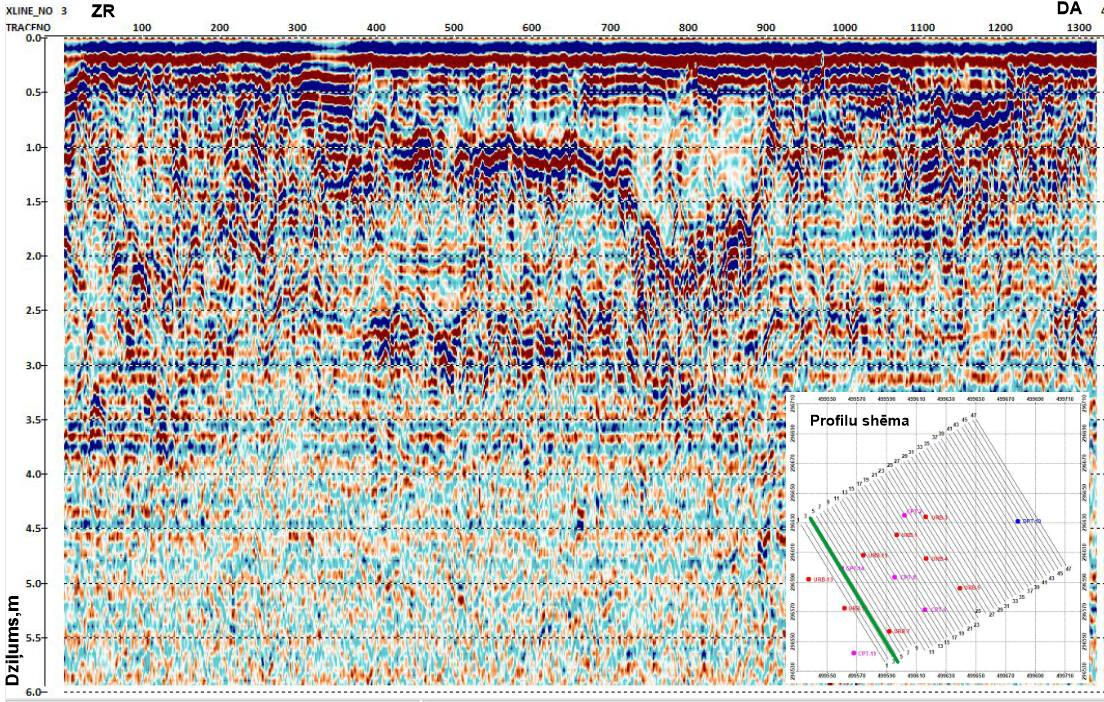
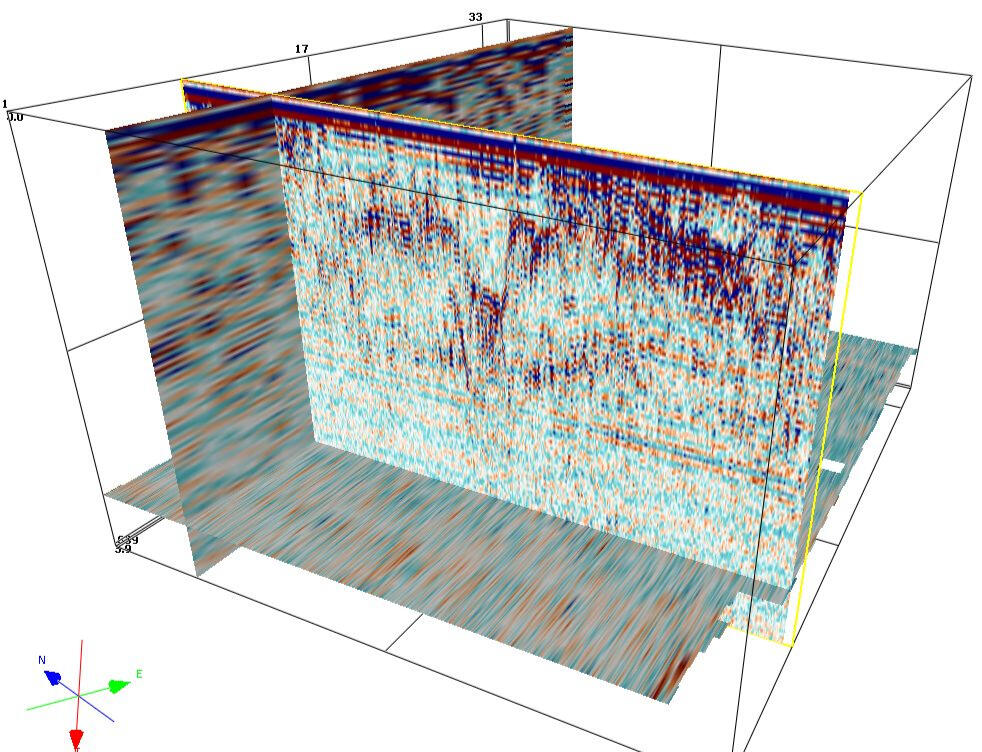
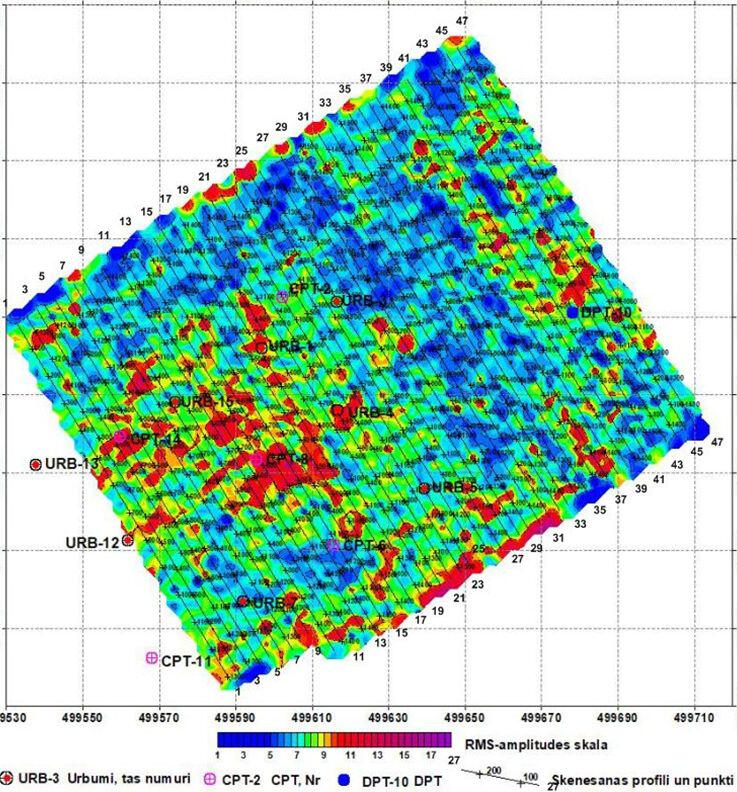
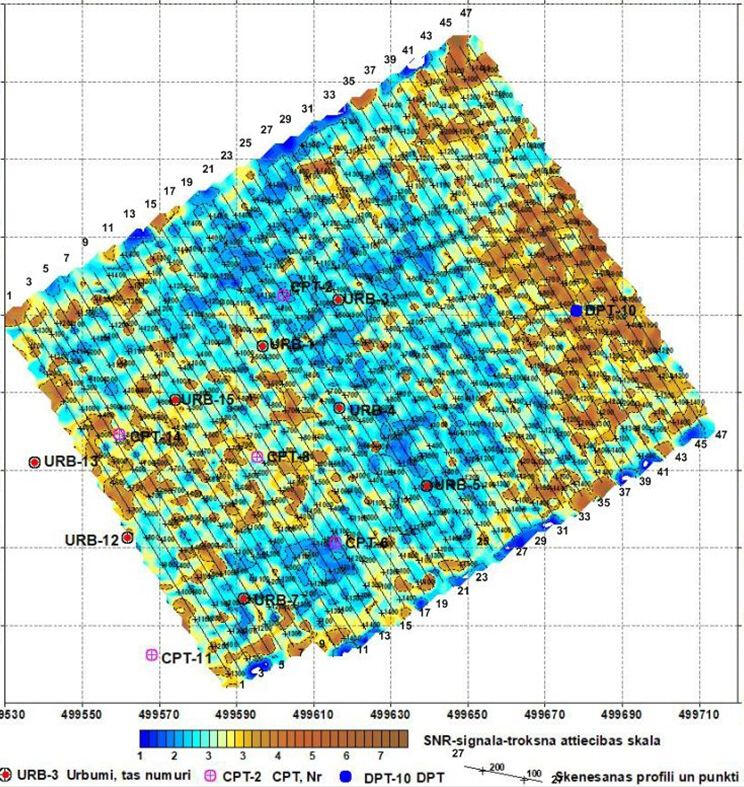
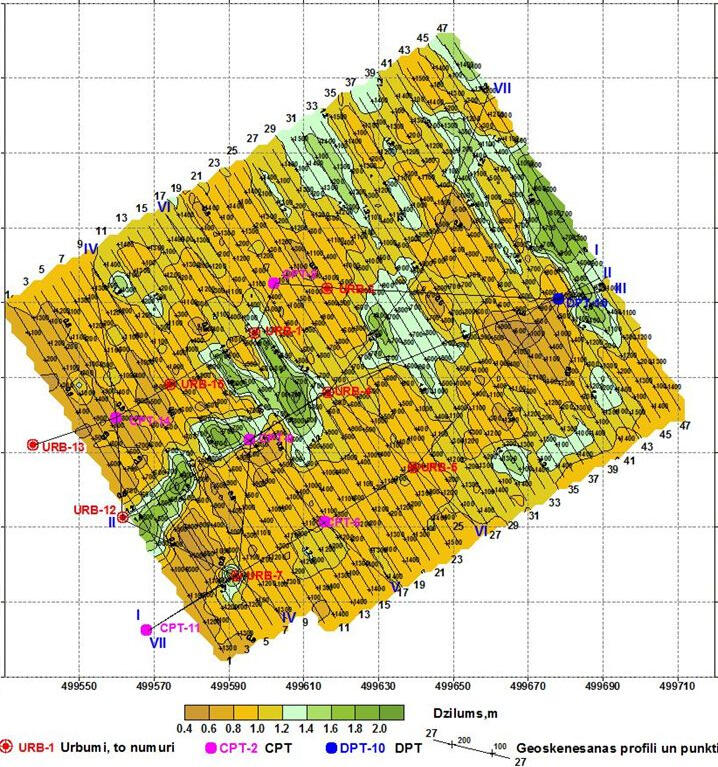
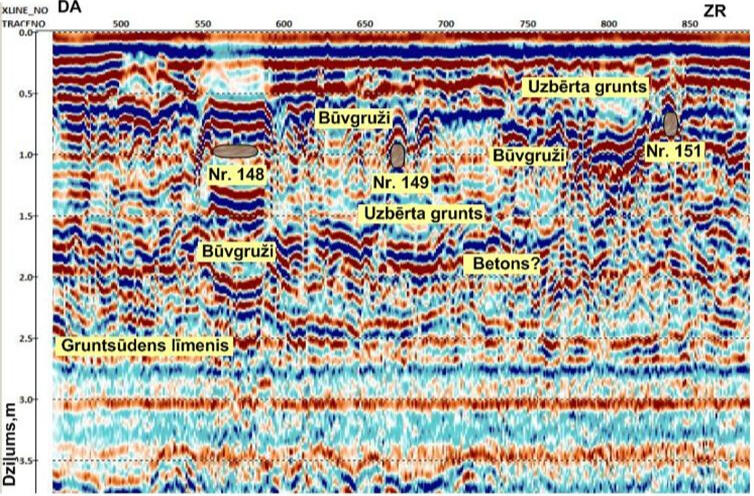
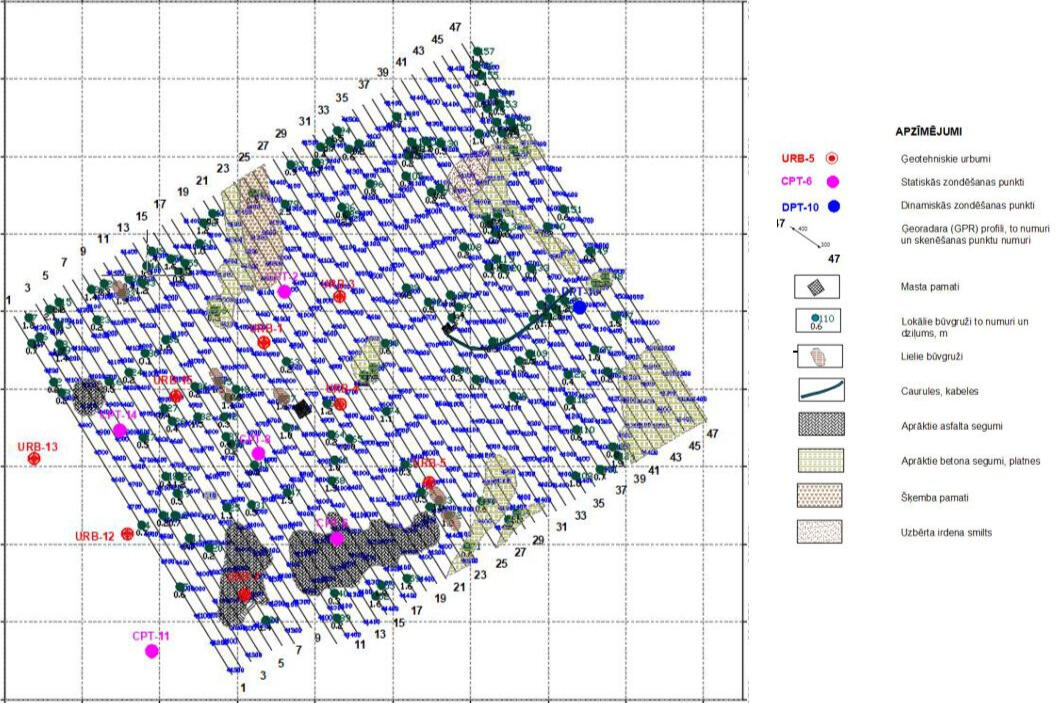
The main objective of the study
The main objective of the study was to identify foreign bodies in the studied areas of the soil massif of the planned site for the reconstruction and construction of the oil depot. A diagnostic sign of the presence of dense foreign bodies or natural objects (large boulders, layers of high-density soil) on ground penetrating radar records is a zone of a sharp increase in the amplitude of the reflected electromagnetic pulse. This is due to sharp jumps in electromagnetic resistance at the boundaries of bodies of different densities.Geoscanning studies were carried out on a land plot of 138x116 m with an area of ~16,000 m2.
Ground penetrating radar
An example of processing a ground penetrating radar profile obtained with a 900 MHz shielded antenna using the RadExPro software package.When profiling with a high-frequency shielded antenna at a frequency of 900 MHz, the recording interval is 200 ns, which corresponds to a probing depth of 13.5-7.5 m in the probed medium, which is represented by practically dried sand of the upper part of the geological section with an average permittivity of 5-16.The signal amplification at the beginning and end of the record is 18/60 dB. A soft bandpass filter was used during the recording. The total number of realizations for one track is 4.
Data interpretation and analysis of results
The interpretation of the obtained GPR data was carried out in three stages. First, so-called data cubes were collected from the profile records - volumetric samples of scanning tracks, an example of which is shown on the left. Using the RadExPro program, which allows you to move and visualize orthogonal planes of the data cube section in three dimensions, anomalous zones of various dynamic parameters of the reflected sweep pulse were identified and localized in an iterative mode.At the second stage, horizontal and vertical sections of the data cube are prepared and processed along the planes intersecting the anomalous zones, which allows obtaining the contours of the anomalous zones in the plan and along the vertical planes.
.
Section of the root-mean-square (RMS) amplitude parameter at a depth of 2.5 m
In order to identify and localize possible man-made objects located in the soil massif, three parameters were selected from the set of parameters used in the calculation that most clearly reflect the above characteristics of the reflected signals - RMS, FRQ and SNR. RadExPro software package.For spatial localization of possible man-made objects on the ground, the records of all profiles obtained using the 900 MHz antenna were combined into one data cube. After that, horizontal sections with the specified parameters were obtained along the planes at different depths from 0.1 m to 3.0 m from the earth's surface. The layer thickness for which the average value of the corresponding parameter was calculated was 20 cm.Horizontal slices of root-mean-square amplitudes in the study area usually give a very complex heterogeneous picture with many small anomalies.
.
SNR parameter slice at a depth of 2.0 m
The signal-to-noise ratio (SNR) parameter describes the degree of identity of adjacent scan tracks. Thus, increased values of this parameter correspond to intervals of the same soil massif that are homogeneous in the horizontal direction. On the other hand, lower values of the parameter are observed in places where the shape of the recording of adjacent tracks changes sharply, i.e. in the presence of sharp heterogeneity of the soil massif.
The SNR parameter slice by area in the upper part of the ground antenna differs significantly from the root-mean-square (RMS) amplitude slice.
.
Relief of reflecting horizons of the soil massif
On many profiles in the surface part at a depth of 30-40 cm, a reflecting boundary is noted, which, apparently, corresponds to the base of the upper sandy layer of technogenic soil. Deeper, a complex wave pattern is observed with reflecting horizons with different slopes and different reflection characteristics. High values of the reflection coefficient correspond to layers of increased density or surfaces of foreign objects.On most ground penetrating radar sections, the surface of a complex reflecting horizon located at a depth of 0.5 to 2.2 m is quite clearly visible. On the site, several depressions with a depth of 1.0 to 2.5 m from the surface are traced on this reflecting surface. The deepest of them has the appearance of a narrow ravine 6-15 m wide and stretches from the southwestern edge of the study area to its center in the northeastern direction.The image on the left shows a structural map of the surface of the depressions. The depth of these depressions sometimes reaches 2.5 m. A wide depression of this reflecting boundary can be observed as a depression elongated to the northwest with a complex configuration of the boundary in plan near the northeastern boundary of the site. Judging by the large number of local inhomogeneities in the layer above this boundary, it represents the boundary of technogenic soil fill from the surface of marine (or alluvial) sand and clay deposits.
Detection of technogenic objects in the soil massif
At the third stage, detailed processing of vertical sections along the most representative profiles was carried out in order to more fully assess the identified objects, their configuration and origin.Signs of large foreign objects, the density of which significantly exceeds the density of the surrounding soil, are areas with a sharp increase in the amplitude of the reflected signal. Smaller objects, the size of which is comparable to the wavelength (at a certain frequency of the probing pulse of 900 MHz, the size is 15-20 cm or more), are represented by diffraction wave packets with a hyperbolic shape of phase axes.Along the profiles near many parts of the site, extended areas of reflections from rigid boundaries were observed. Given the presence of several reflection phases, the anomaly can be interpreted as the remains of the foundation of a small building and asphalt pavement.
Localization scheme of underground man-made objects
Signs of manifestation of small local objects in the soil were found on almost all processed profiles. A total of 157 such objects were identified. The location of the objects is shown in the figure. Each identified object is assigned a number and the depth of its upper surface is marked on the map. The contours of large-area buried objects, such as asphalt and concrete pavements, concrete slabs, rubble backfill, are marked on the map without indicating numbers. The database contains the coordinates of the objects identified, their quantity and depths, as well as the numbers of profiles and scanning points.In the southwest corner of the study area, at a depth of 0.4 m to 1.0 m, two widely buried fields of asphalt or concrete pavement were identified. The presence of an asphalt layer in the soil at a depth of 0.6 m was confirmed by drilling data from a geotechnical borehole.
Oil terminal “Ventspils nafta” of the port of Ventspils
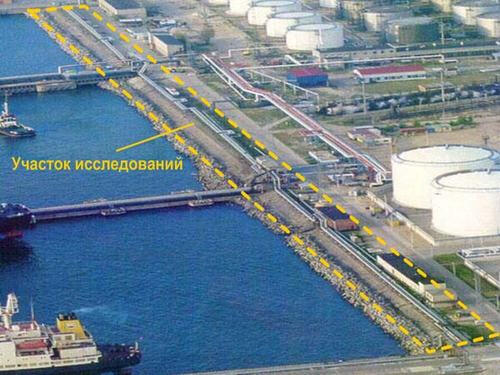
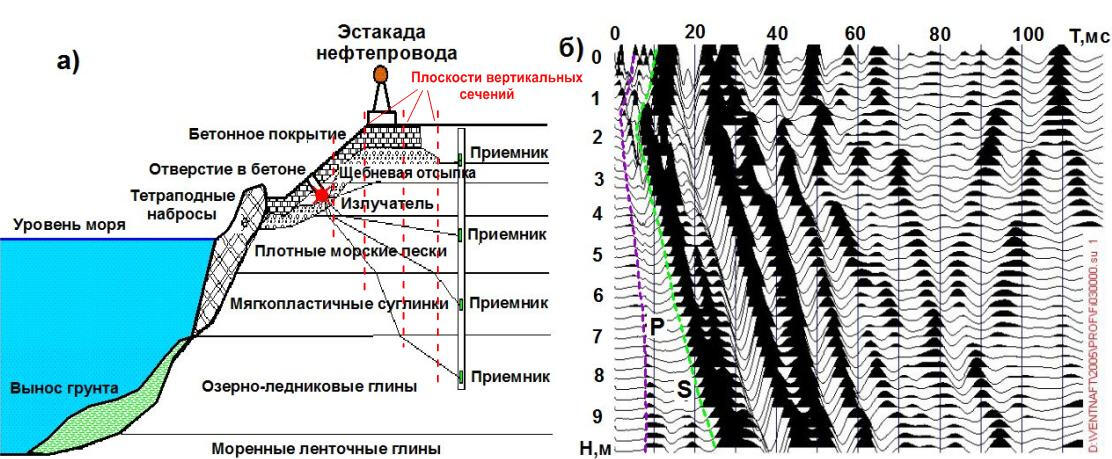
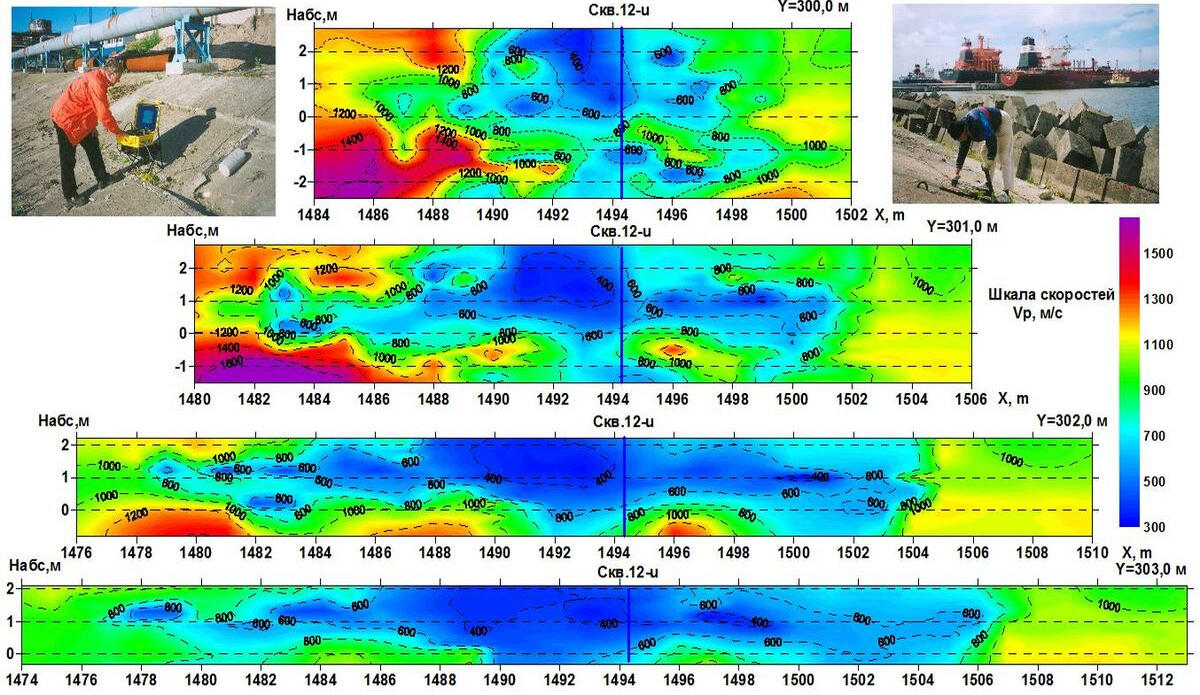
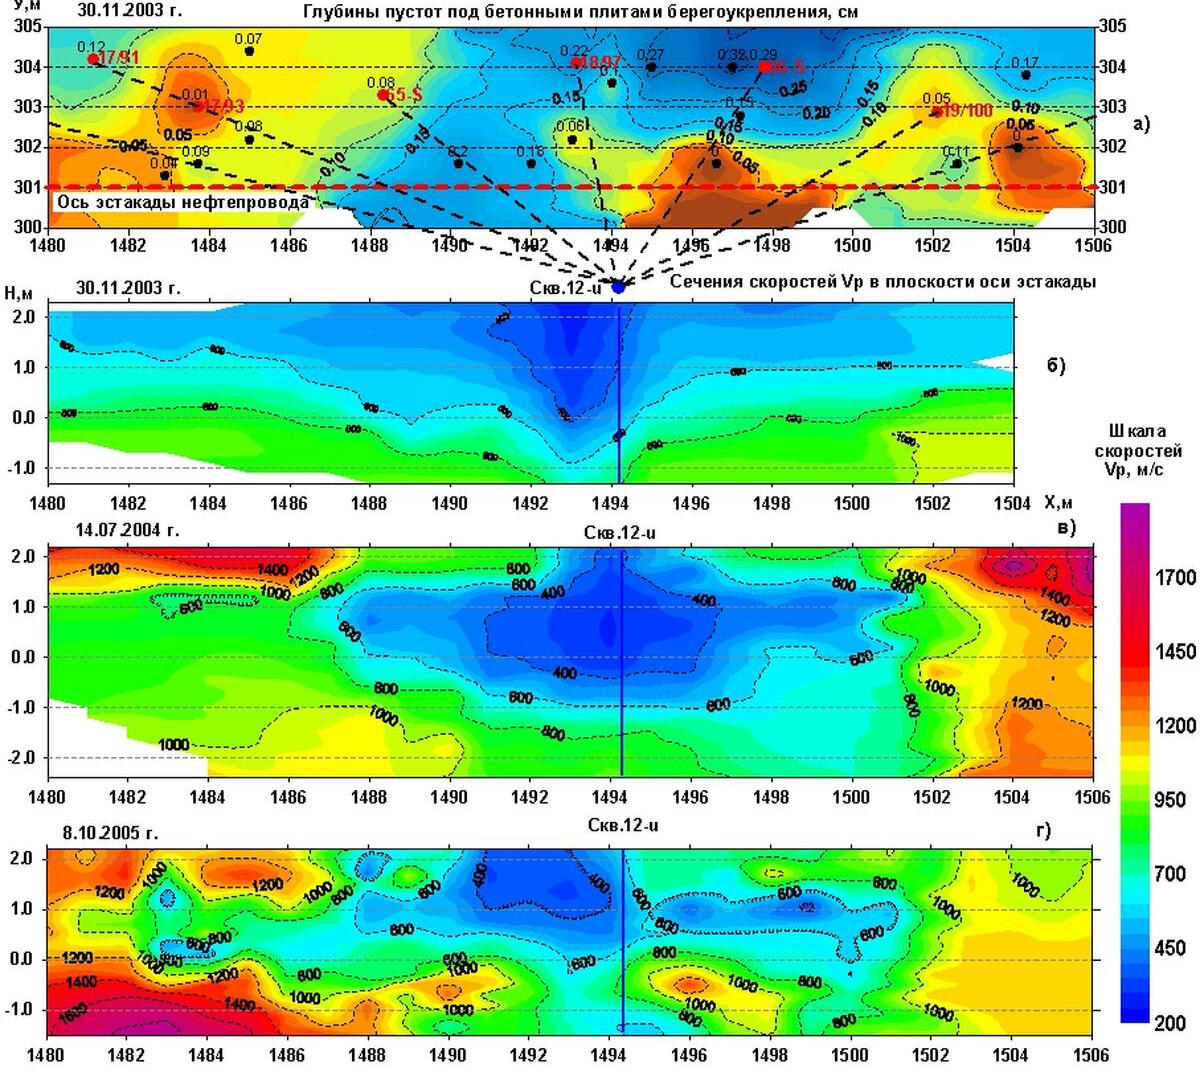
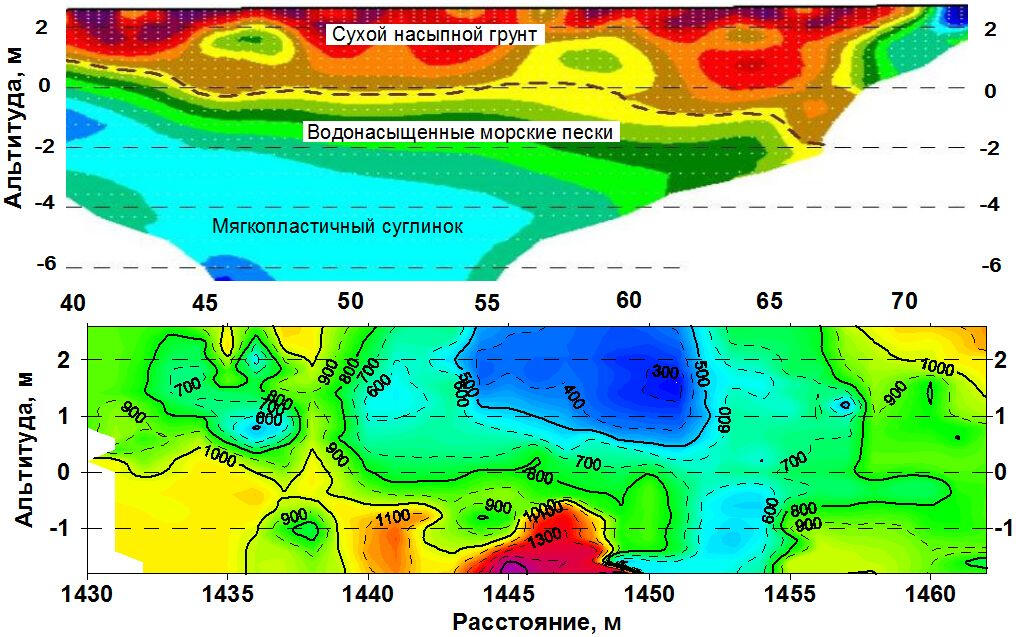
The study and monitoring of the condition of the soil massif on oil terminal shore
The work was carried out with the aim of preventive measures designing to strengthen the upper part of the soil mass, primarily at the sites of transfer oil pipeline overpass supports installation. The objective of the work was to determine the distribution of longitudinal wave propagation velocities in soils of the overpass foundation in the band of 3-4 m to a depth of 4-5 m below the distributing pipeline pillars foundation level .
The scheme of seismic-acoustic scanning of the soil massif and an example of seismic record
The value of soil massif surface subsidence under the slabs of concrete structures was established visually by drilling of holes in concrete with a diameter of 150 mm. Holes were drilled by the customer with an interval of 4-6 m along the shore of oil terminal. In greater part of holes at the sites of ground subsidence below the slabs the voids between the lower surface of concrete slabs and gravel dumping on the surface of a soil massif were identified.On the areas of greatest subsidence of concrete slabs at the top of the bank protection wells were drilled to a depth of 8-10 m. For the estimation of the spatial distribution of velocity heterogeneities of the soil massif acoustic scanning was performed with the excitation of oscillations in the holes on the shore slope and receiving in the wells cased with plastic pipes.Distances from the axis of well to the holes at the oscillations excitation points varied from 6 to 40 m. However, as a rule, at distances over 30 m it was rarely possible to obtain clear records of longitudinal waves in the first breaks due to the high level of noise generated by the machines of tankers and compressor stations, as well as due to insufficient energy of the impact during excitation of elastic vibrations. Thus, for each of wells it was possible to perform the scanning on the bank slope section up to 60-70 m long.
Vertical sections of longitudinal wave velocities in one of the areas of coastal strengthening plates sagging
Vertical velocity sections are obtained along vertical planes parallel to the axis of the transfer oil pipeline overpass. The planes of the vertical cross-sections located at intervals of 1 m. Axis of the pipeline supports corresponds to a section along the plane passing through the ordinate 301,0 m. For each polygon, the resulting cross-sections for the planes with the ordinates 299, 300, 301, and 302 m were calculated. Because of the characteristics of seismic rays distribution and spatial arrangement of their refraction points velocity sections in different planes have different limits on the depth and on coordinate X. At the series of sections low-velocity anomalous zone to depths over 3-4 m are discovered, expanding towards the sea.
Monitoring of longitudinal wave velocity distribution at one of the sites of repair-and-prophylactic works
Some drilled holes in the concrete were used for injection of plasticized cement solute into voids and at intervals of soil decompaction. The other part of the holes was preserved and used to re-measure of elastic waves propagation velocity in the soil body of the shore strengthening in next two years after the repair.At left is a map of the voids under the slabs at the time of repair work start (а) and vertical cross sections of the velocities prior to injection (б), 7,5 months after the injection of plasticized concrete (в) and 15 months after repair (г). The sections clearly show the compaction of the subsurface layer of the soil massif. The residual zone of reduced velocities near the observation well projection is associated with the soil massif decompaction in the well bottom space, which occurred during its drilling.
Manifestations of suffusion focus in soils of upper part of the coastal slope on the electric field tomography section and on P-wave velocity section
Low values of electrical resistance and longitudinal wave velocity correspond to local areas of possible manifestation of suffosion processes.
Investigations of the soil condition of the coastal slope and water area of "Ventbunkers" oil terminal
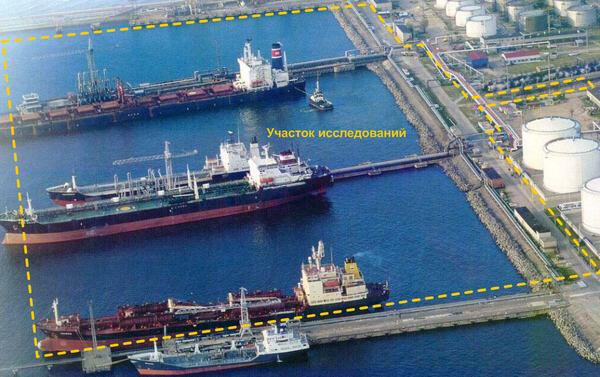
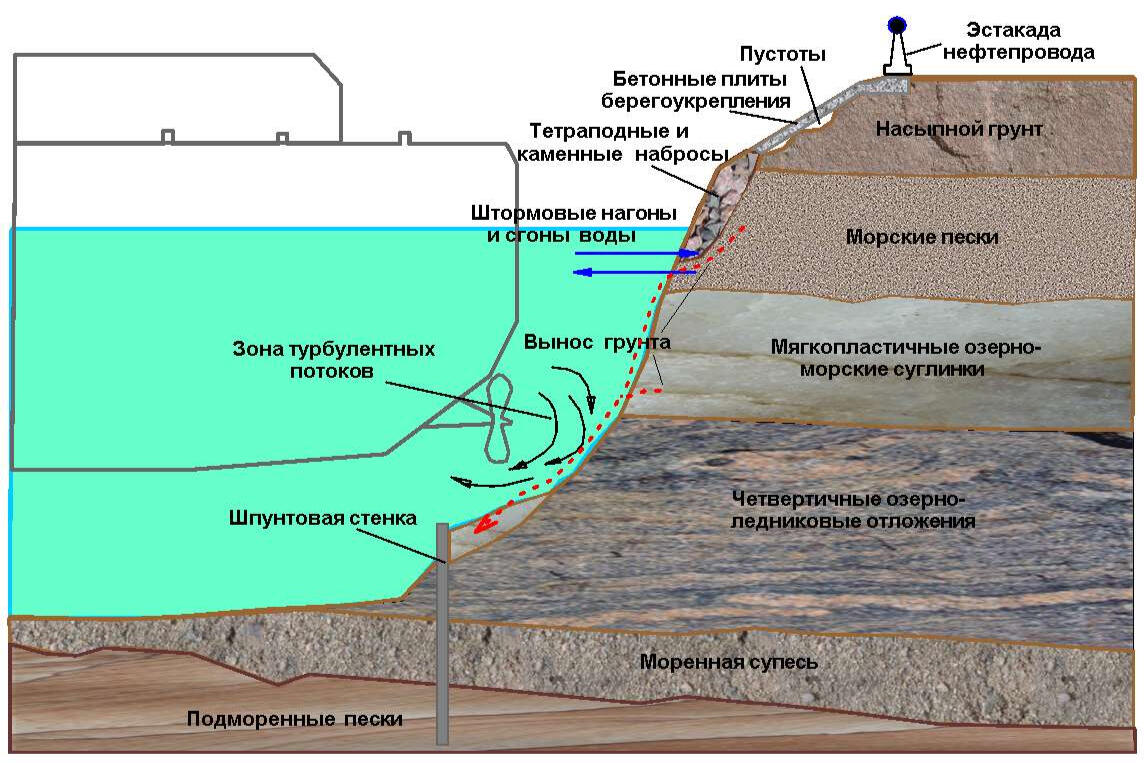
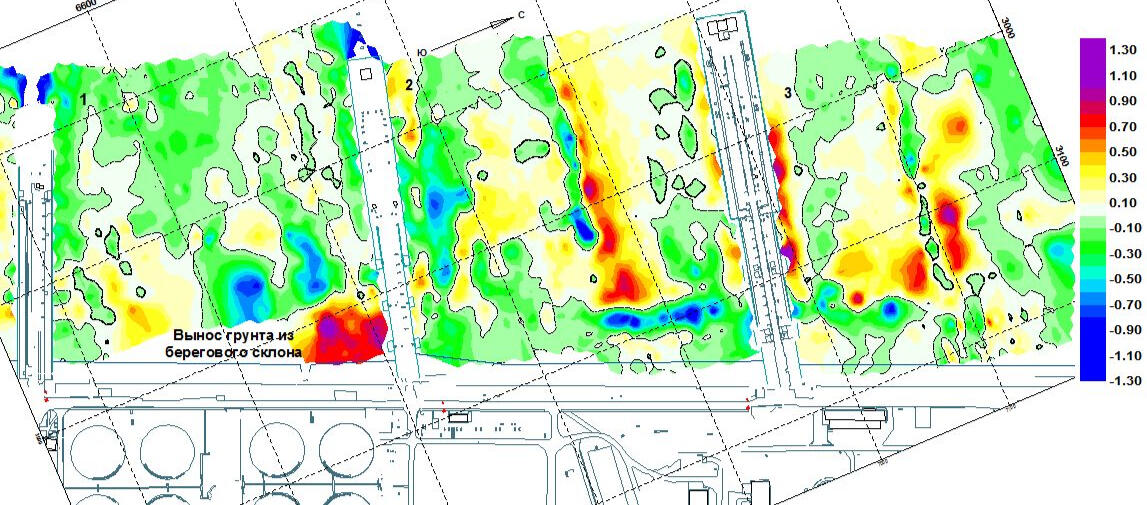
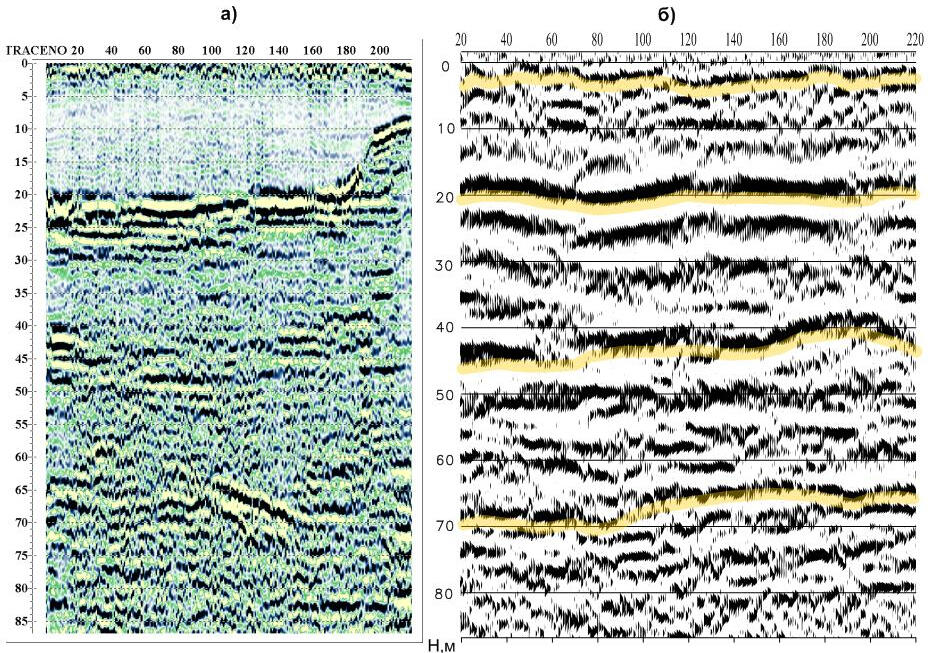
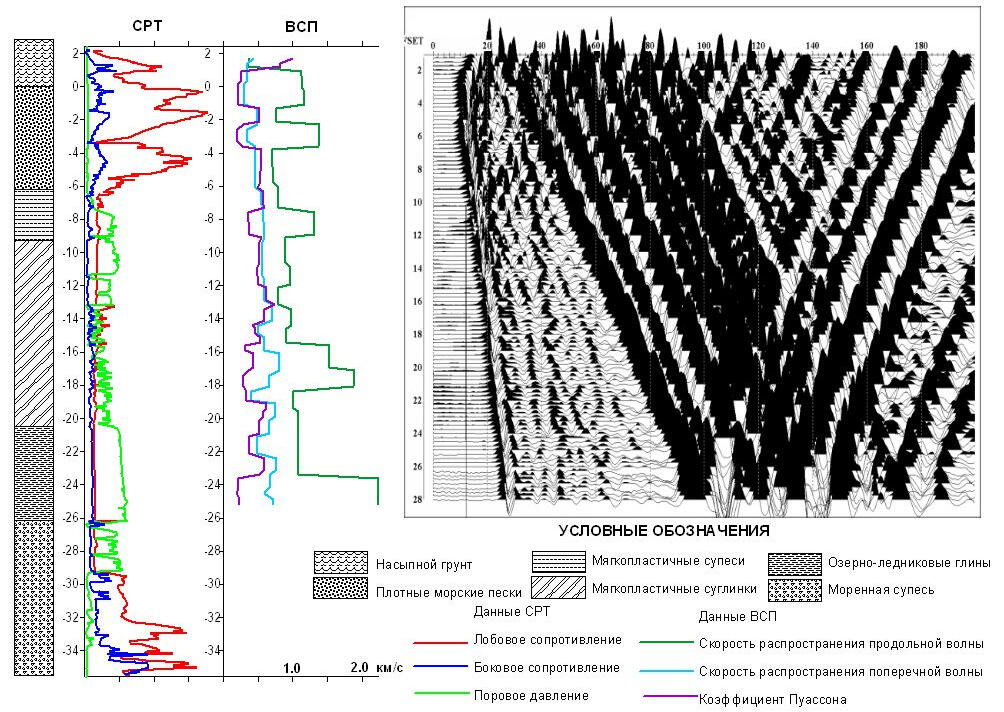
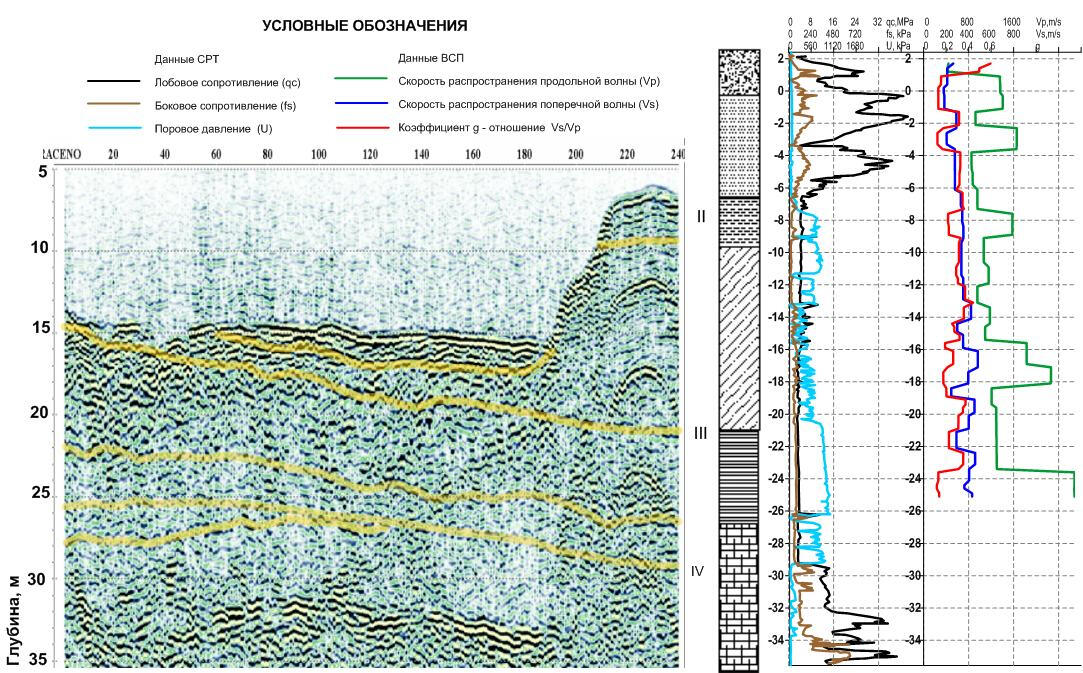
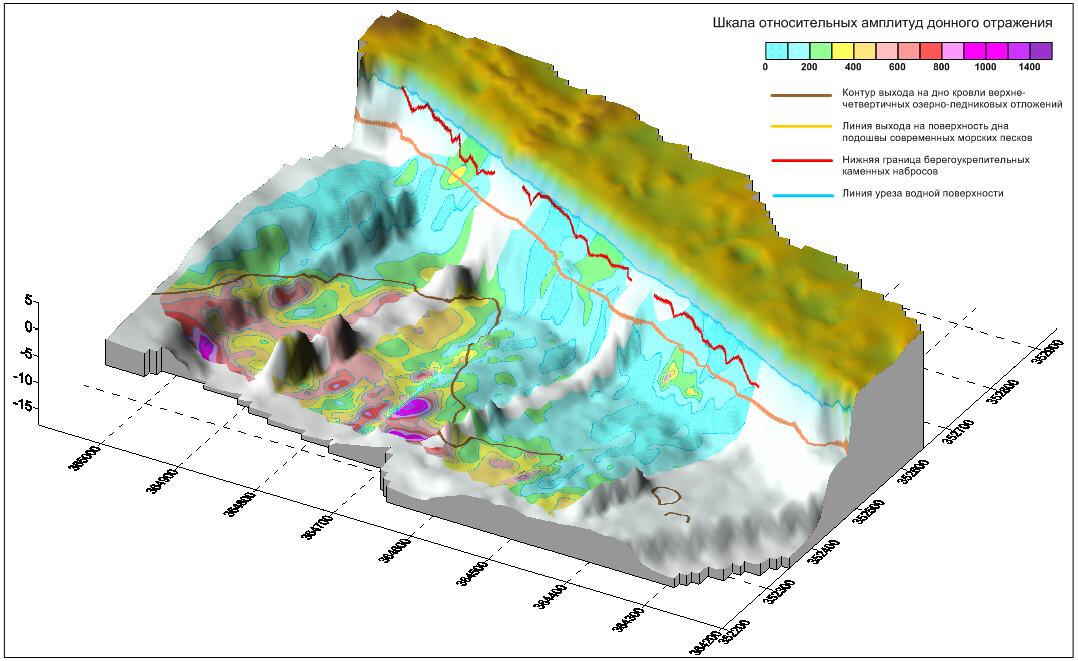
Investigations of the soil condition of the coastal slope and the port water area
Geophysical studies were performed after the large-scale dredging works in the port aquatory. As a result of the bottom deepening along the piers, the steepness of the shore slope and the angles of the bottom slope along the boundaries of the deepening works increased. With the increase of accepted tankers tonnage, lithodynamic processes on the bottom of backwaters and, to a large extent, on the coastal slope were sharply intensified. The soils of the coastal slope under a layer of loose sands are represented by weak marine sands, lake-sea loams and lake-glacial deposits, easily subjected to suffocation and mechanical effects of turbulent flows from the working screws of large tankers. One of the negative results of this was the removal of fine fractions of sand from the ground base of shore protection, the formation of extensive zones of decompaction and voids under concrete slabs. During heavy storms and water level rising due to the water surge, cases of concrete slabs subsidence became more frequent.
Deformation of backwater seabed and coastal slope
To assess the deformations of the seabed echosounding measurements data were used and high-frequency channel of the side-scan sonar survey. Soundings were performed along profiles oriented mainly along the quays. The profiles along the shore were made as linking ones. The velocity of acoustic waves in the water was taken from the calibration tables taking into account the temperature of the water and its salinity. During the measuring work the water temperature was + 6 degrees, so the velocity of sound in the water was taken 1436 m/s.The accuracy of the depth determination was of ±0.1 m. The distance between the profiles was 20 m. Depth determination points interval along the profile in average 4 m. The detail of the measurements matches the scale of 1:500.The obtained data were compared with the data of measuring works performed a year earlier, immediately after dredging in the backwaters. The most noticeable deformations of the opposite sign were revealed along the sides of the soil excavations and along the bank slope. As can be seen from the map below deformations of the bottom topography along the borders of the excavations slumping of their sides took place and raising the elevations of the bottom inside of excavations. The height of sediment accumulated along the sides in some places exceeded 1 m.Along the foot of the bank slope, mainly, the lowering of the bottom marks was observed due to sediment leaching during tanker screw working. In the southern backwater at the initial part of the second pier a large positive deformation was revealed - accumulation of a soil layer up to 1.5 m high taken out of the coastal slope. Later, according to the drilling of a set of 3 wells on the adjacent section of the shore and non-londitudinal VSP performance in them, a significant anisotropy of elastic wave velocities in the soils massif was revealed with a sharp velocity decrease in direction to the coastal slope. In subsequent years, studies of the coastal slope under the plates of shore protection in this area confirmed the high speed of suffosion processes.
Subbottom profiling in backwaters and shallow seismic exploration on the shore
Works for soil properties investigations included the side-scan sonar survey and subbottom profiling in the water area. Cone penetration testing, drilling of geotechnical wells, vertical seismic profiling and sallow seismic profiling by the method of reflected waves (CDP) were performed on the shore. Despite the significant difference in the frequency range of elastic waves when working on land and in the water area, it was possible to link the main reflecting horizons in the depth range up to 85 m.
Cone penetration testing and vertical seismoacoustic profiling
The records of non-longitudinal VSP in wells, cased with plastic pipe, along with the first arrivals of the direct longitudinal wave has a distinctly intense outgoing and upgoing hydro-waves which sources the harmonics of low-frequency surface wave are coming from the shock source to a wellhead at the surface of a soil massif. Hydrowave velocity closely connects with the transverse wave velocity in space of well trunk and can be used to calculate elastic modules of the soil massif.The anisotropy of surface wave velocities in the layer of bulk soils and marine sands underlying them is clearly manifested in the records of non-longitudinalt VSP from two remote sources located perpendicular in the direction from the well with receivers along the coastline at a distance of about 25 m from the beginning of the slope and in the direction from the well towards the coastal slope. The energy attenuation and delay of the surface wave modes arrival to the wellhead in the direction perpendicular to the shore are well manifested on the sounding records.
Stratigraphic control of seismic and acoustic sections
Cone penetration test data and VSP was used for stratigraphic control of reflections from the boundary layers, singled on the subbottom profiling sections in the backwaters. The layers of Quaternary soils and moraine are uplifted towards the open sea with the exit on the bottom of dense moraine soils in remote parts of the water area.
Reconstruction of the bottom relief and its reflectivity on the backwaters area
A map of the reflectivity of the seabed soils, depending on the magnitude of their acoustic impedance and, accordingly, the density imposed on the volumetric reconstruction of the bottom relief, gives an idea that on the coastal slope and on the greater coastal part of the water area the bottom is represented by weak Quaternary soils. In these areas of the backwaters it is necessary to expect significant deformation of the bottom relief associated with erosion and re-deposition of bottom sediments. It may occur in shallowing of bottom areas along piers and erosion of the foot of the coastal slope in zones of intensive influence of turbulent flows from operating screws of tankers.
Riga port Bulk terminal
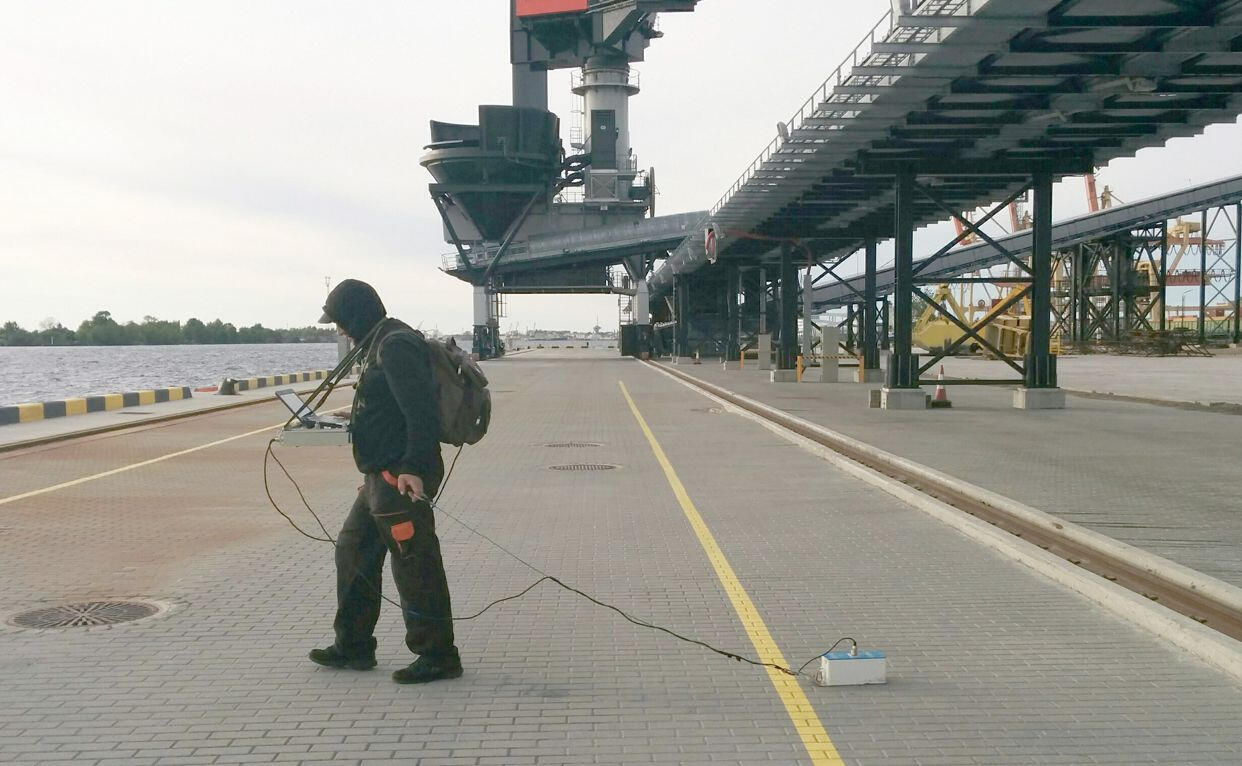
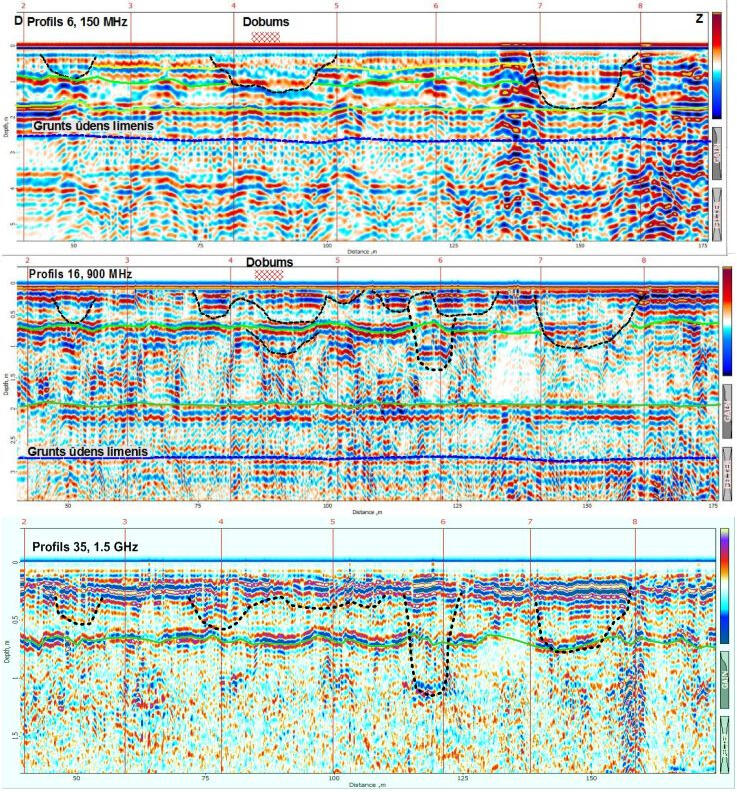
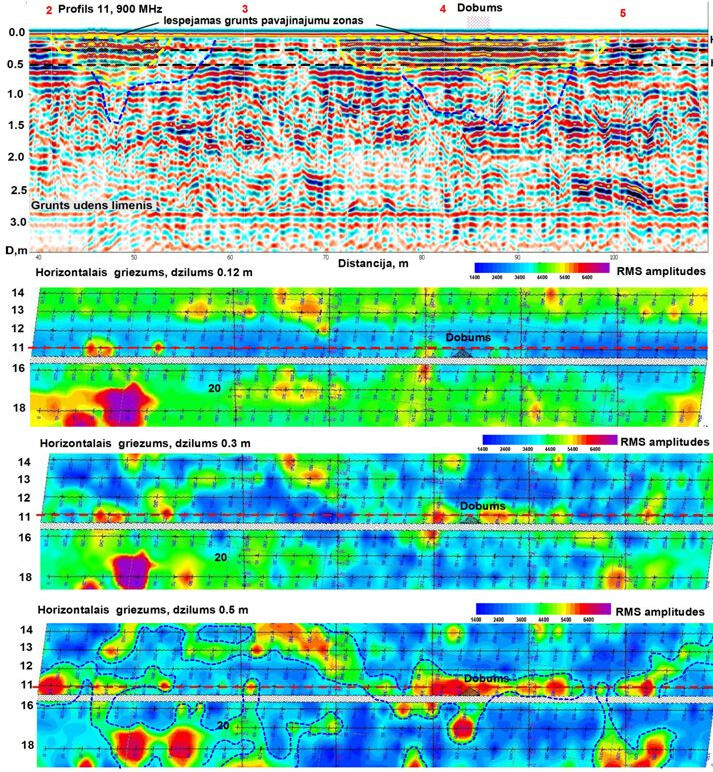
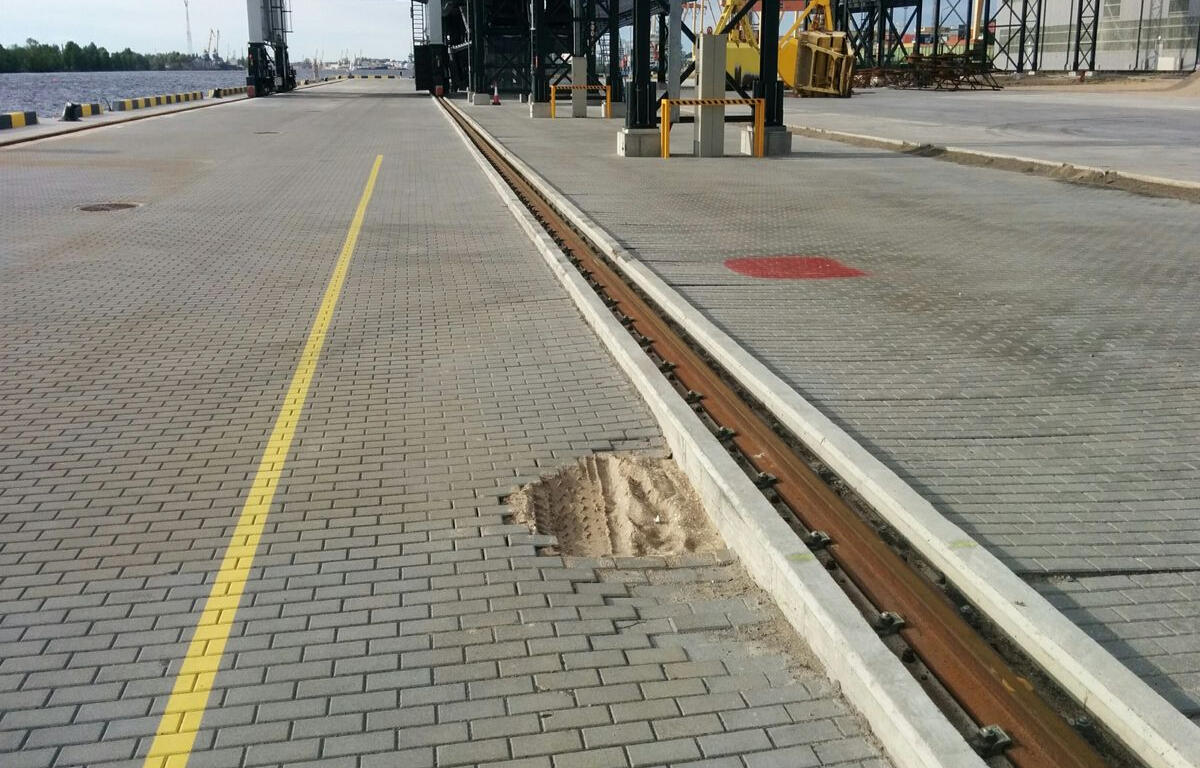
Objective of the work
Multi-frequency ground penetrating radar
Conduct research and determine the technical condition of the pier soil massif, recording possible areas of soil loosening, caverns and voids. Assess the soil condition. Conduct ground penetrating radar research of the harbor foundation using a set of dipolar and shielding antennas of different frequencies, which provides a research depth of up to 3-4 meters.In the reporting materials, the ground penetrating radar sections of the areas should display possible loosening and subsidence of the soil, voids, caverns and flooding conditions of the soil massif, determined by sufusion processes, inclusions of large construction waste in the soil massif of the pier embankment.
The GPR sections obtained along the same profile at frequencies of 150 MHz, 900 MHz and 1.5 GHz
GPR sounding at different frequencies gives significantly different results when working out the same profile. Depending on the energy and frequency of the sounding pulse, the depth of penetration of the signal and the peculiarities of its reflection from the boundaries of the soil massif with different physical properties, lithology and the degree of water saturation vary significantly. Interpretation of different frequency GPR sections gives mutually complementary information about the structure and properties of the studied soils.The presence of surface diffracting objects near the profile, especially metal structures, has a significant impact on the view of sections obtained with low-frequency dipole antennas. In the left part of the upper section the traces of intense diffracted waves from the nearby metal pillars can be seen.
.
.
GPR vertical section and horizontal cross section of the RMS-amplitudes according 3D GPR sounding on the frequency 900 MHz
GPR sounding on a dense network of profiles allows to create a data cube, represented by samples of amplitudes of the reflected signals, which can be transformed into cubes of different dynamic parameters of the reflected signals. Maps of these parameters distribution on the horizontal sections of the cube give an idea of the distribution of various inhomogeneities in the soil array, affecting the passage and reflection of electromagnetic pulses. One of the most significant factors affecting the amplitude of the reflected sounding pulse is the degree of water saturation of the soil. It is possible the areas of high amplitude reflections track the channels of groundwater seepage, which occurs suffusion of the foundation soil and removal of fine fractions of sand into the area of unloading.These horizontal sections show the shape of the filtration channel in sandy soil at a depth of about 0.5 m under the paving of the embankment of the cargo terminal of the port. The channel is formed at place of surface water infiltration near the under crane girder and unloaded in the river at the quay wall. The low amplitude reflections along the under rail beam at a depth of 12 cm correspond to voids and softening, formed as a result of the surface subsidence of the foundation soil.
Failure of the pier pavement
Failure of the pier pavement in the place of intensive suffusion processes and formation of a cavity in the soil massif
Sea passenger terminal of the port of Riga
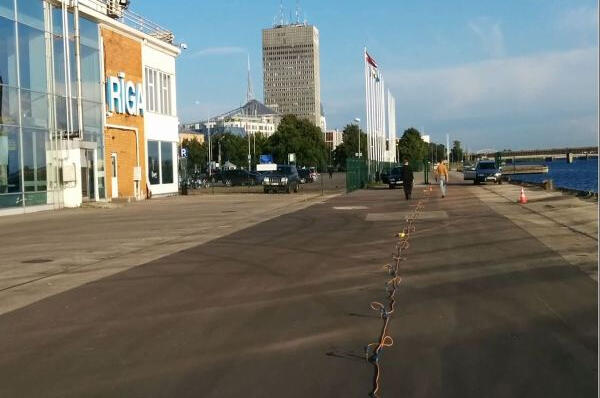
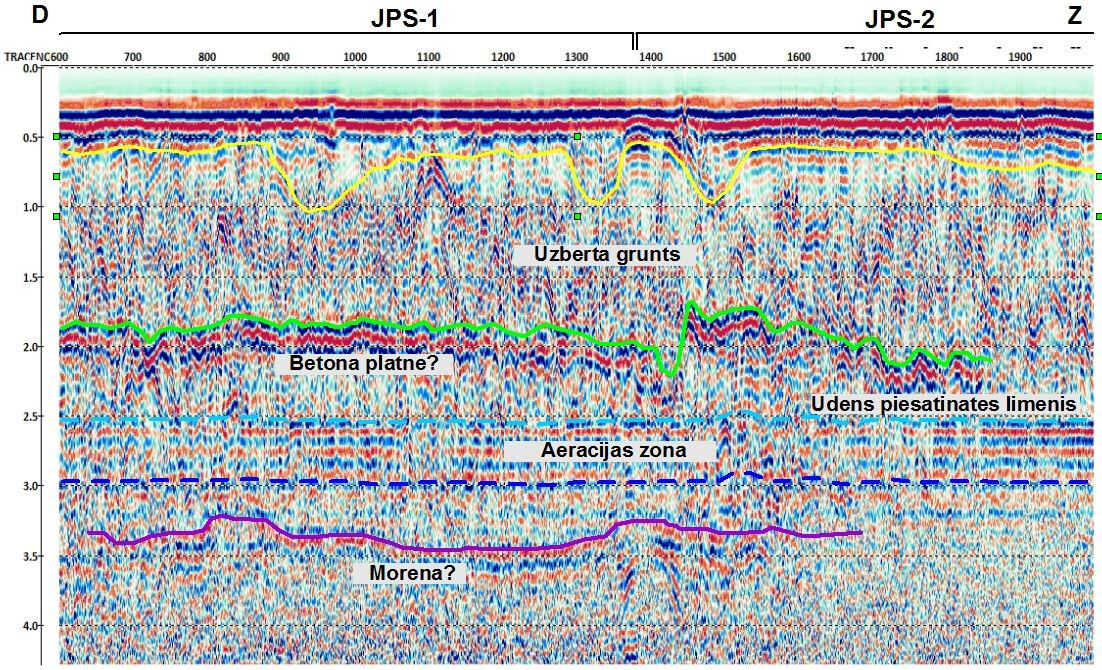
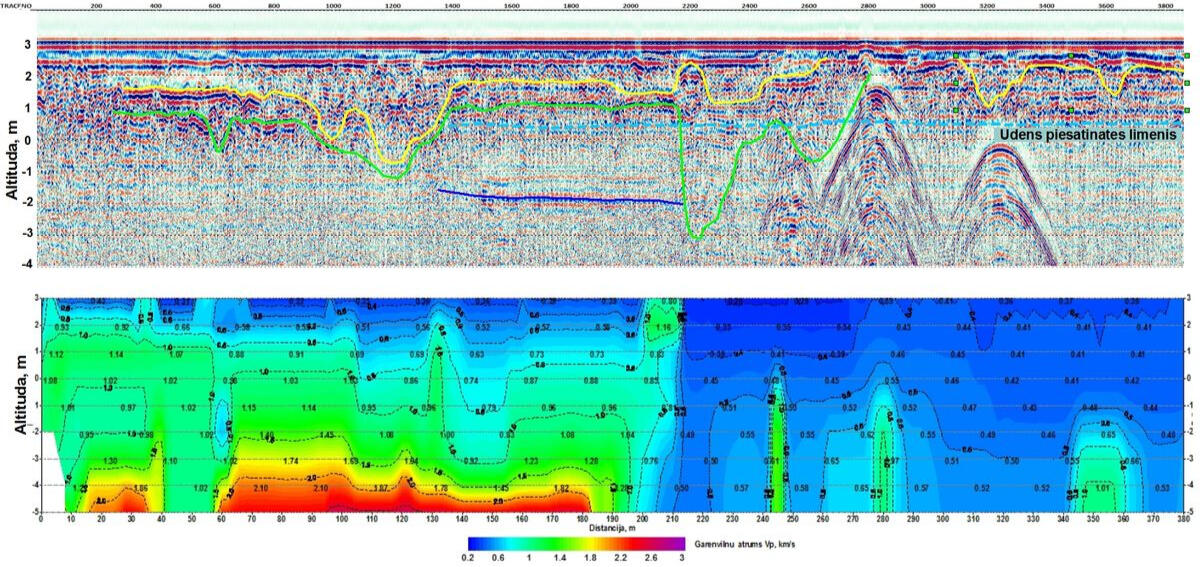
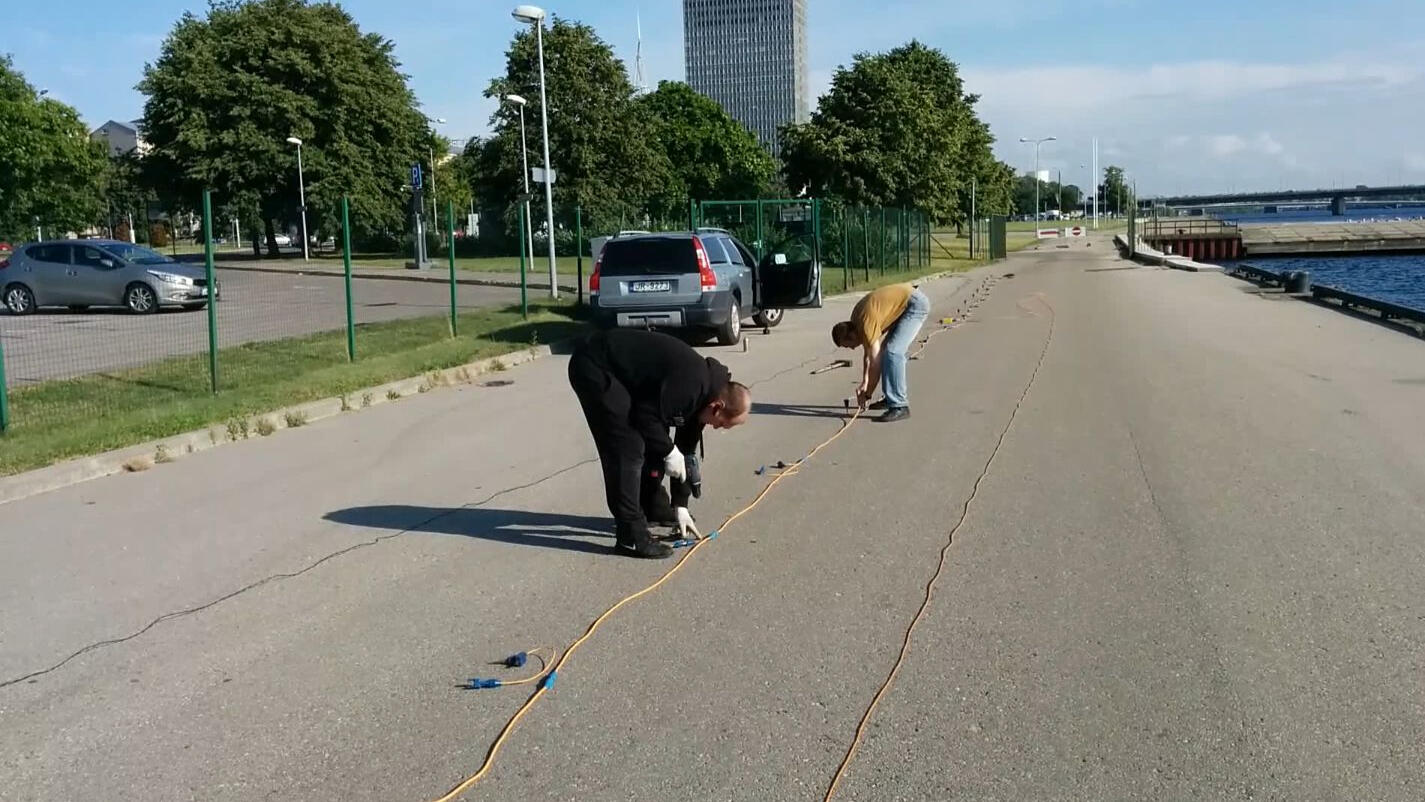
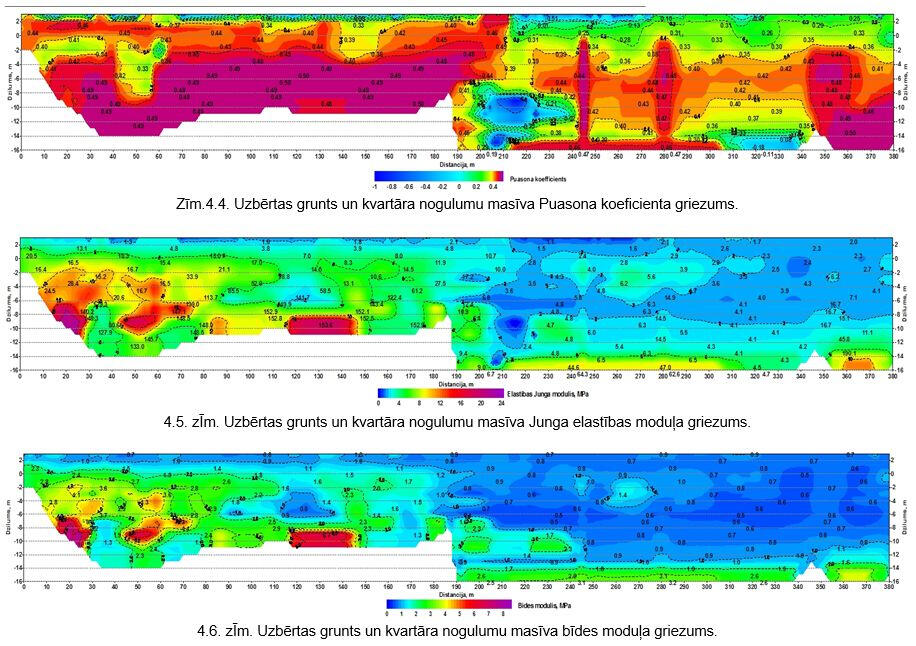
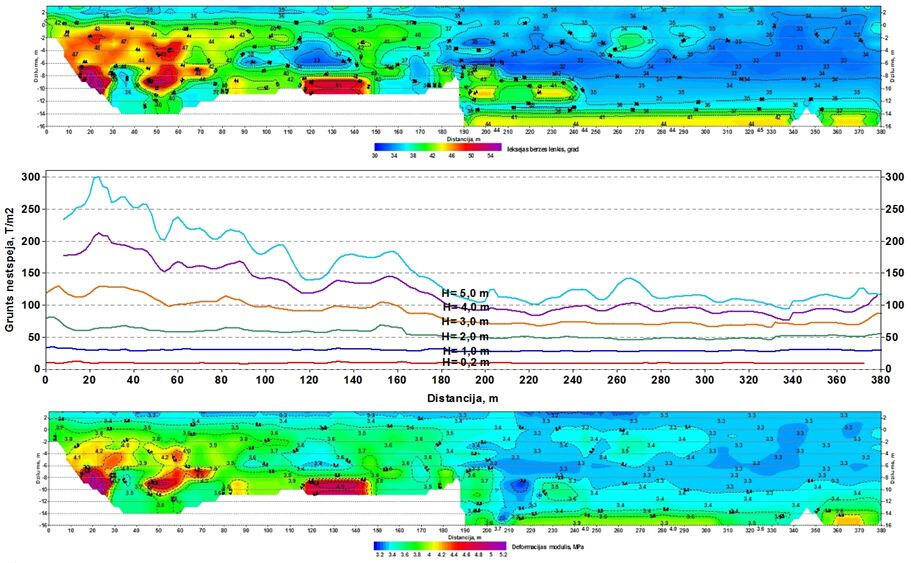
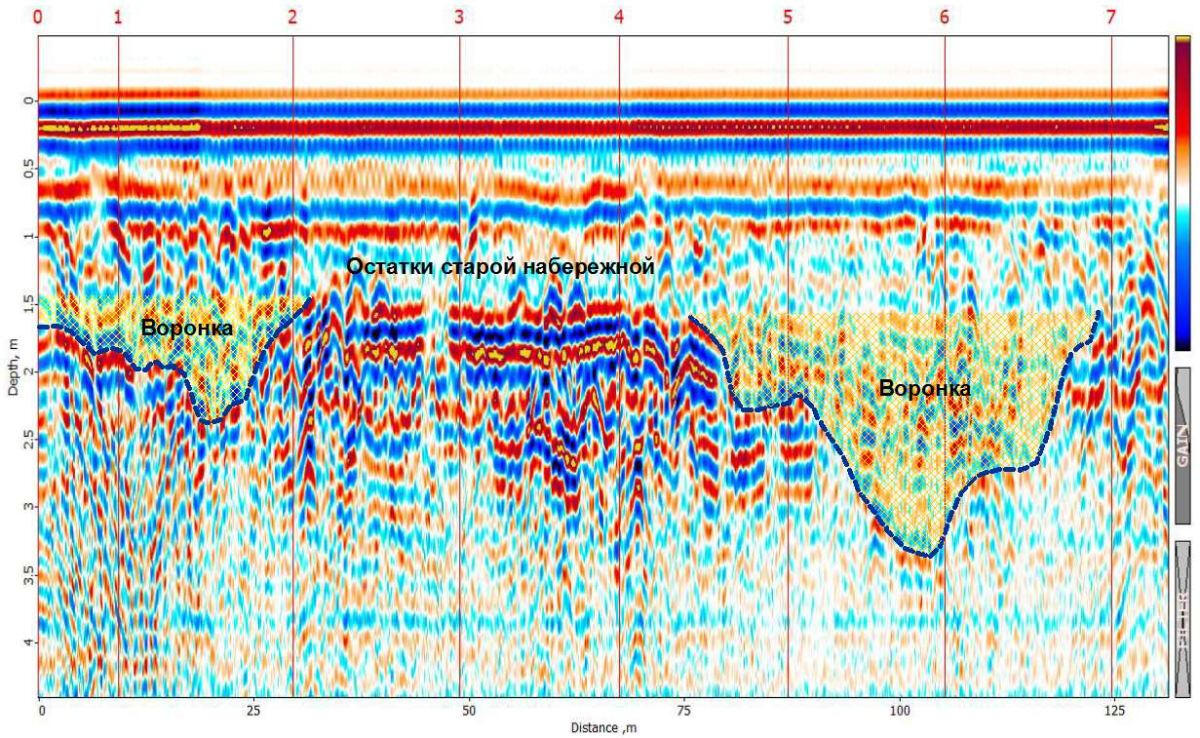
Study of the soil base of the passenger terminal berth of the Riga port
The work was carried out to identify the heterogeneities and structure of the soil base of the passenger berth and to outline the places of manifestation of suffusion processes with the removal of small fractions of soil into the river, which are the cause of failures and subsidence of the hard asphalt pavement of the embankment. Sections obtained with different frequencies of the probing pulse and with different types of antennas ambiguously display the characteristic features of the structure of the soil massif of the embankment base.
GPR section along the berth wall, obtained with a 150 MHz antenna.
The reflective boundary at a depth of 70 cm is most clearly manifested in low-speed cuts and can be identified with the upper layer of the backfill, at the base of which a layer of geotextile is laid. It is visible on all profiles within the boundaries of the JPS-1 and JPS-2 supports (while the reflection registration times are practically the same everywhere), and this, in turn, makes one doubt the possibility of its geological binding to any surface of the division of the physical properties of the main soil. It can be interpreted more reliably, taking into account the a priori data on the structural features of the pier supports.
GPR section along the pier wall, obtained using an antenna, 900 MHz.
Three reflecting horizons are traced in the section quite clearly. The first, at a depth of 40-80 cm, corresponds to the boundary between the crushed stone cushion and the sandy soil massif. The second horizon is separated by a clearly defined reflecting boundary at a depth of 1.6 m on the JPS-1 pier to a boundary at a depth of 2.1 m in the southern part of the JPS-2 pier, where this horizon is not traced in areas. Judging by the sharp jump in the propagation velocity of longitudinal waves at this depth (up to 2.7-2.9 km/sec), this may be due to the asphalt concrete or stone covering of the old bank.
A georadar section along the center of the passenger terminal pier, obtained using a 150 MHz antenna and a section of the velocity of longitudinal waves.
Comparing the data of georadar sounding and comparing them with the results of shallow sounding using the seismic exploration method, we can conclude that there is a visible correspondence between the anomalous zones in the georadar and seismic sections, which are interpreted as areas of low soil density and propagation velocity of longitudinal waves.A decrease in the velocities of shear waves in these same areas is associated with a decrease in the adhesion and density of the solid skeleton, or more precisely, the solid phase of unbound soil in places where fine fractionation occurs, and does not depend on the water saturation of the soil.In places where low-velocity elastic waves propagate, porosity and water saturation increase, while the permittivity of leached soils decreases. On radar sections, this manifests itself as an increase in the travel time of an electromagnetic wave and "delays" in the recording times of waves in the soil reflected from underlying boundaries.
Shallow seismic exploration
The IS128.03 portable multichannel seismoacoustic recorder is designed to record signals based on the registration of seismoacoustic vibrations by IM2416 telemetry modules (technical parameters are given in the "Equipment" section).Seismic pulses were excited by blows of an 8 kg sledgehammer on a 15 x 15 cm rubber plate. To improve the signal-to-noise ratio, signals from three acoustic pulses were accumulated at each excitation point.The signals were received using a 32-channel geophone cable, the channel pitch was 2 m, the total length was 62 m. Each channel contained one OYO-GEOIMPULSE-20 geophone.All seismic observations were carried out on one profile parallel to the cordon line, located 7.0 m from it. Profiling using the refracted and surface wave methods was performed on one profile 380 m long.
Interpretation of shallow seismic exploration data
For preliminary interpretation of seismic profiling data, predicted geomechanical parameters of the soil along the profile were calculated based on longitudinal and transverse two-dimensional velocity sections.Using the velocity Vp and Vs, the original sections obtained as a result of data processing using the SeisOptim and SeisImager/MASW software packages, sections with calculated soil moduli are shown in the figure on the left:
- Poisson's ratio (transverse deformation);
- Young's modulus of elasticity;
- shear modulus.Then the predicted soil parameters were calculated.
- general deformation modulus;
- angle of internal friction;
- specific adhesion;
- bearing capacity of the soil.
Calculation of soil bearing capacity
The figures show the calculation of soil bearing capacity in comparison with some areas predicted by geomechanical parameters and radar sections. The calculation was made using the formula (p. 2.41 SNiP 2.02.01-83 "Fundamentals of buildings and structures").Although the calculation of the bearing capacity, like other geomechanical parameters, was carried out along the profile line, located 7 m from the cordon, the calculated values in the horizontal direction will characterize the volume of soil, which is comparable in size with the radius of the first Fresnel zone, determined by the relationship (1):R = ½(λh0)0.5 (1), where:
R is the radius of the first Fresnel zone, λ is the wavelength,
h0 is the depth of the study.In our case, the calculations were carried out based on seismic vibrations, the central frequency of the pulse spectrum of which is 50 Hz, and the propagation speed of longitudinal and transverse waves in the surface layer is 130-130-400 m / s. The wavelength λ in dry sand is 2.5-20.0 m. According to the relationship (1), the radius of the first Fresnel zone at a depth of 5 m will be 2.5-4.5 m, at a depth of 10 m - 3.5-6.3 m. The corresponding values will characterize the studied strip of the soil massif, for which the calculation parameters will be relevant.
Mapping the surface relief of the old embankment
The work revealed a sharp difference in the structure and physical properties of the soil massif of the foundation in the southern (old) and northern (new) parts of the passenger berth. Under the bomb-cratered surface of the old pier in the southern part of the pier there are dense natural alluvial and moraine soils, while the foundation of the northern part of the pier is made up of fill soils. The georadar section shows strong diffracted waves associated with technological wells and the foundation of the pedestrian landing gallery.
Kruonis pumped storage power plant (Lithuania)
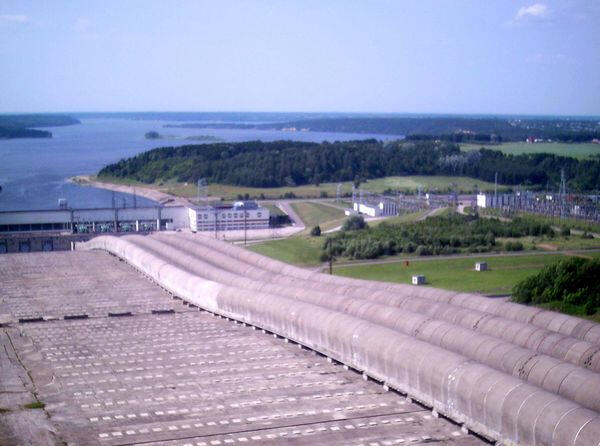
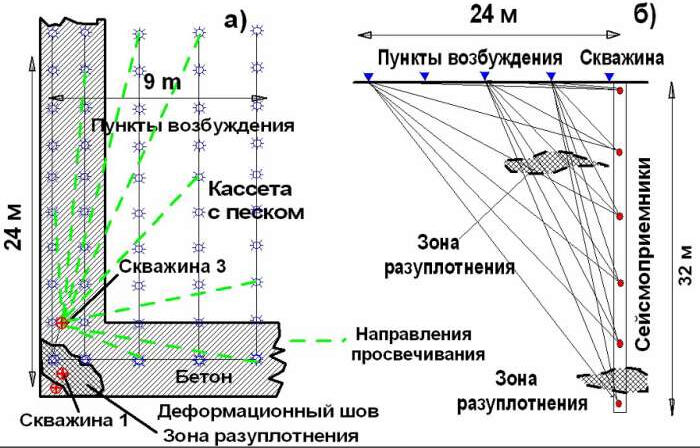
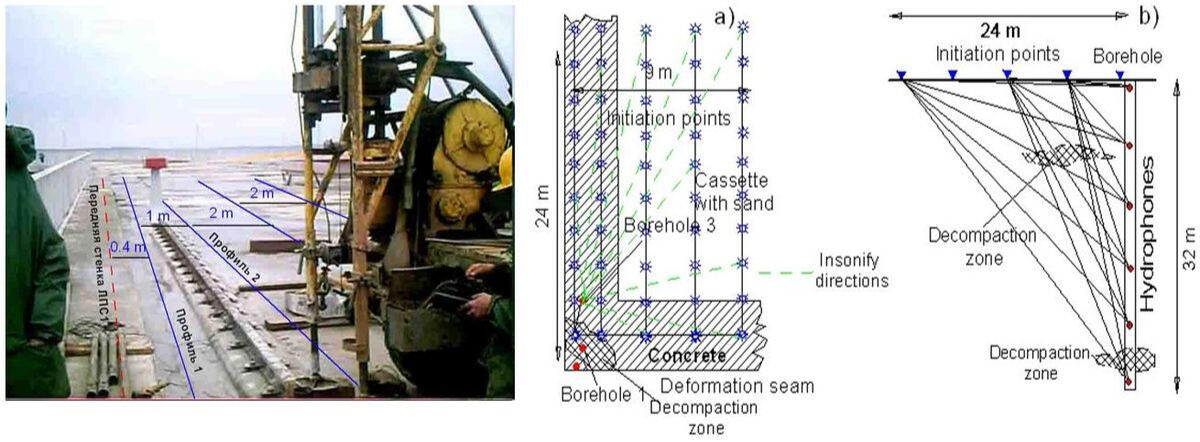
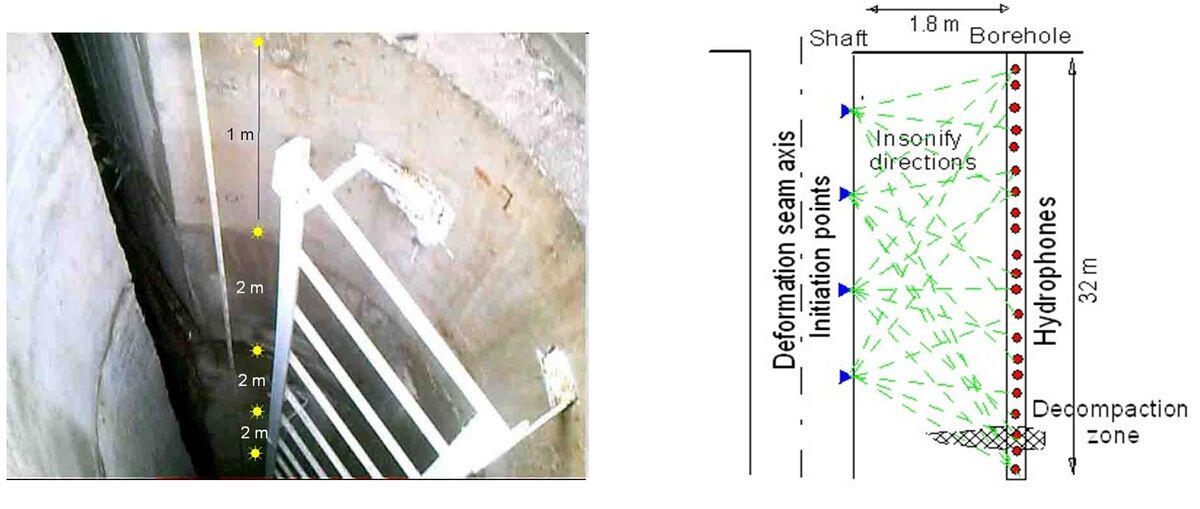
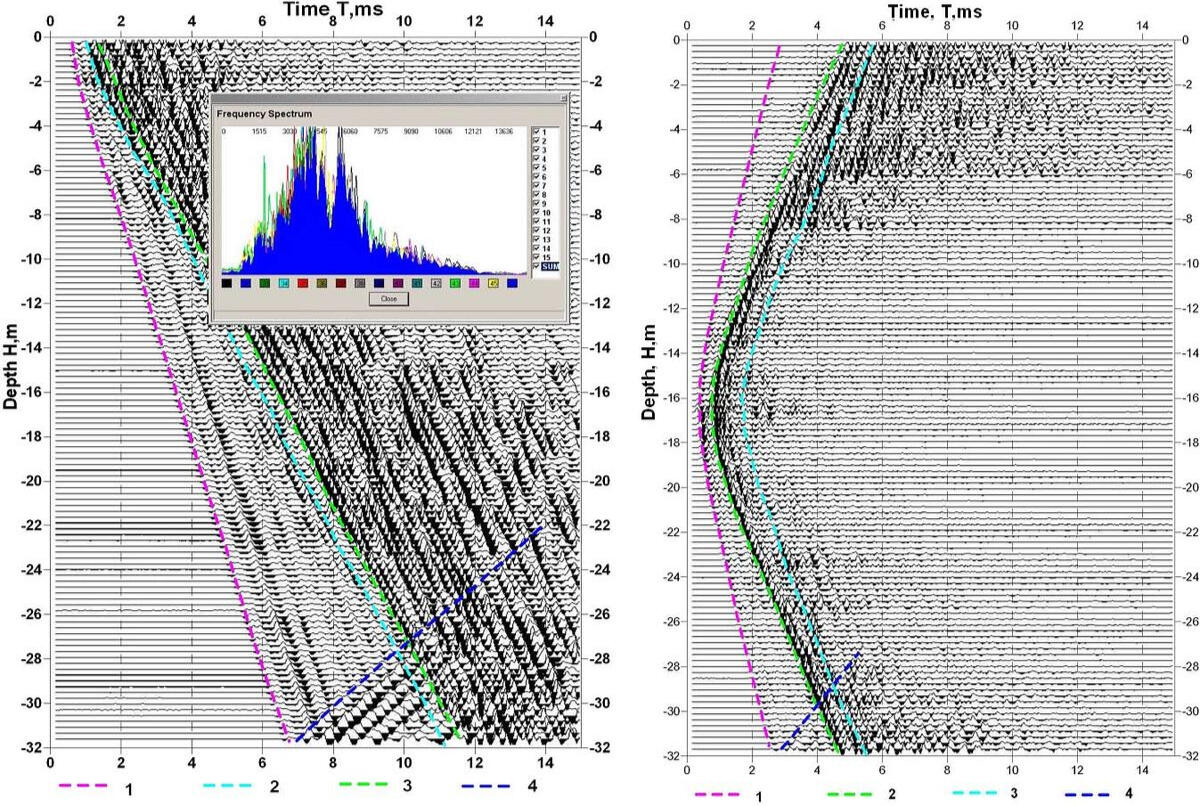
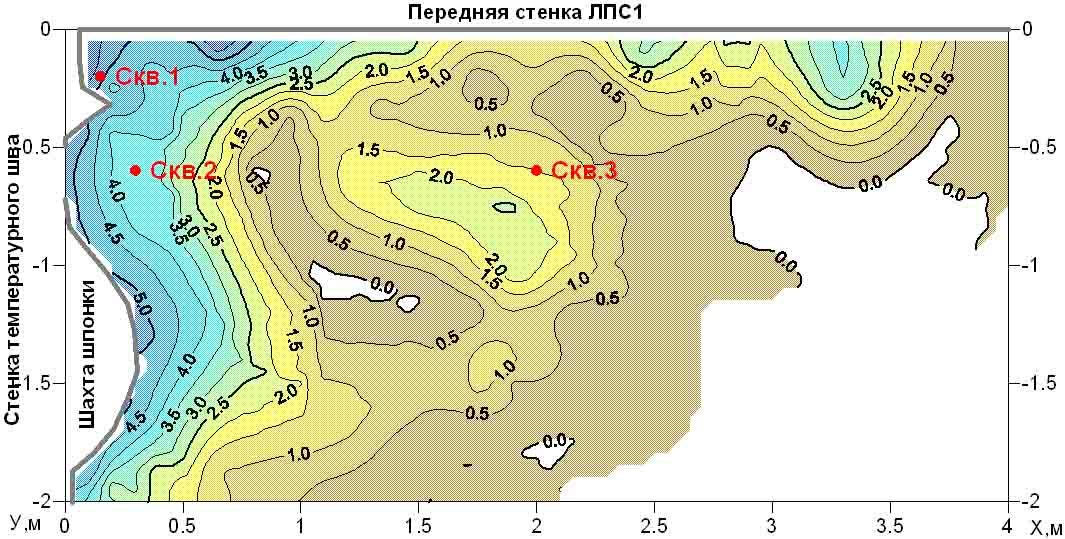
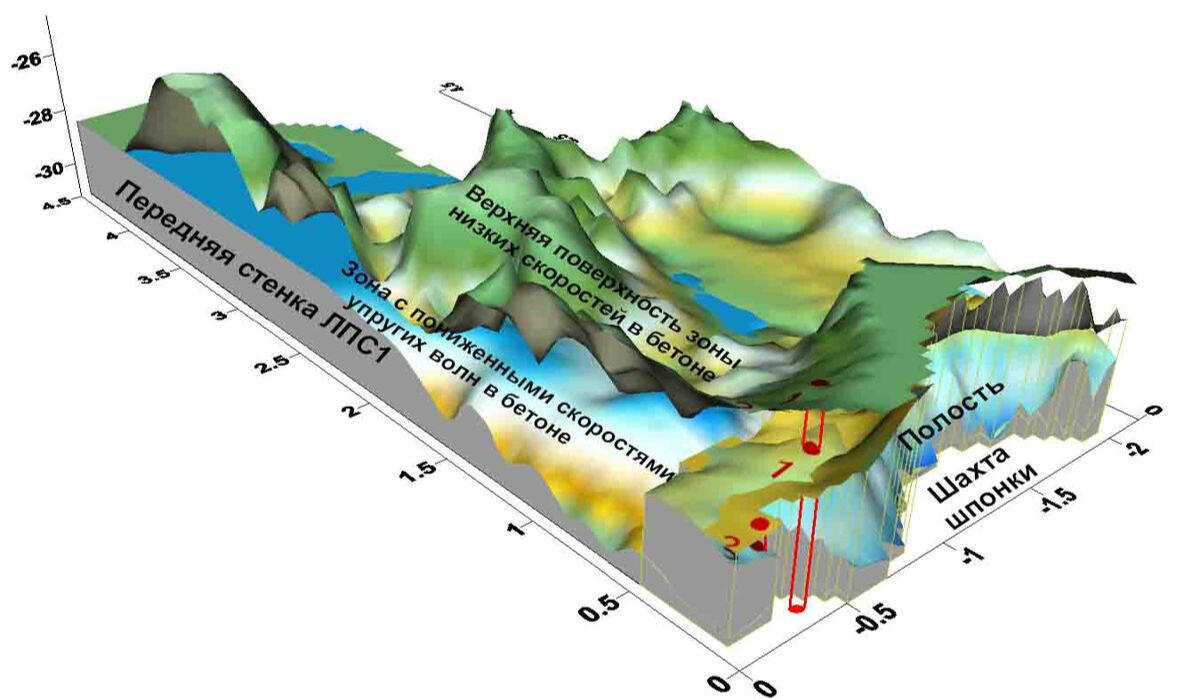
Study of the dam concrete walls erosion and of water leakage from the reservoir
The studies were performed in the borehole with depth of 32 m, which were drilled in the concrete wall of the upper reservoir dam of Kruonis PSPP – pumped storage power plant (Lithuania) with the aim of identifying and establishing the extent of concrete decompaction zones in the place of water leakage from the upper reservoir along the temperature seam. The study of the properties of concrete by the method of non longitudinal VSP was carried out at excitation of elastic oscillation by blows of a 1 kg weight hammer on the surface of dam concrete block across the network of parallel profiles with the distance between them 2 m. Points of excitation step along profiles was 2 m. The piezo-hydrophonic 16-channel probe was placed in a well filled with water and moved up with step 25 cm as all the excitation points on the surface were worked out. Thus, the step between the receiving channels in the compilation seismograms was equal to 25 cm.
Non longitudinal VSP method work scheme from the dam surface
The study of the properties of concrete by the method of non longitudinal VSP was carried out at excitation of elastic oscillation by blows of a 1 kg weight hammer on the surface of dam concrete block across the network of parallel profiles with the distance between them 2 m. Points of excitation step along profiles was 2 m. The piezo-hydrophonic 16-channel probe was placed in a well filled with water and moved up with step 25 cm as all the excitation points on the surface were worked out. Thus, the step between the receiving channels in the compilation seismograms was equal to 25 cm.
Acoustic scanning method work scheme from the observation shaft
The study of the concrete properties by method of acoustic scanning was performed at excitation of elastic oscillations by blows of a 1 kg weight hammer in the observation shaft located parallel to the observation well at a distance of 2.6 m. Piezo-hydrophone 16-channel probe was placed in the hole filled with water.
.
Examples of non longitudinal VSP records and seismic acoustic raying
On the resulting records of non longitudinal VSP (left) and acoustic transmission from inspection shafts to the well (right) the first breaks are well traced of the waves in the steel reinforcement of walls with velocity of about 5300 m/s, and in concrete with a velocity of 3100-3200 m/c. The central frequency of the oscillations spectrum in both cases was in the range of about 1600 Hz.
Dam block concrete wall decompaction map in the area of leak
According to the time-distance curve of the wave first break in concrete at a depth of 28-32 m in the wall of the cassette block of the dam adjacent to the deformation seam, a decompaction zone was revealed in which velocity of the longitudinal wave propagation was below 2,700 m/s. Thickness of this zone near the wall was more than 4.5 m, gradually decreasing towards the inner surface of the cassette block wall. This zone corresponds to the depth of interval in which the water flows from upper reservoir fixed along the deformation seam, causing leaching and erosion of concrete wall of the block.
Volumetric reconstruction concrete decompaction zone and a cavity in the area of the leak
Obtained by a sufficiently dense network velocity cross-sections in vertical planes were used to construct a volume of wave velocity distribution in the block of dam and for reconstruction of a decompaction zone spatial position in concrete and a cavity in the wall of the block resulting from the leaching action of water flow.
Gas leaks on the bottom of the Ob River on a section of main pipelines (Western Siberia, Russia)
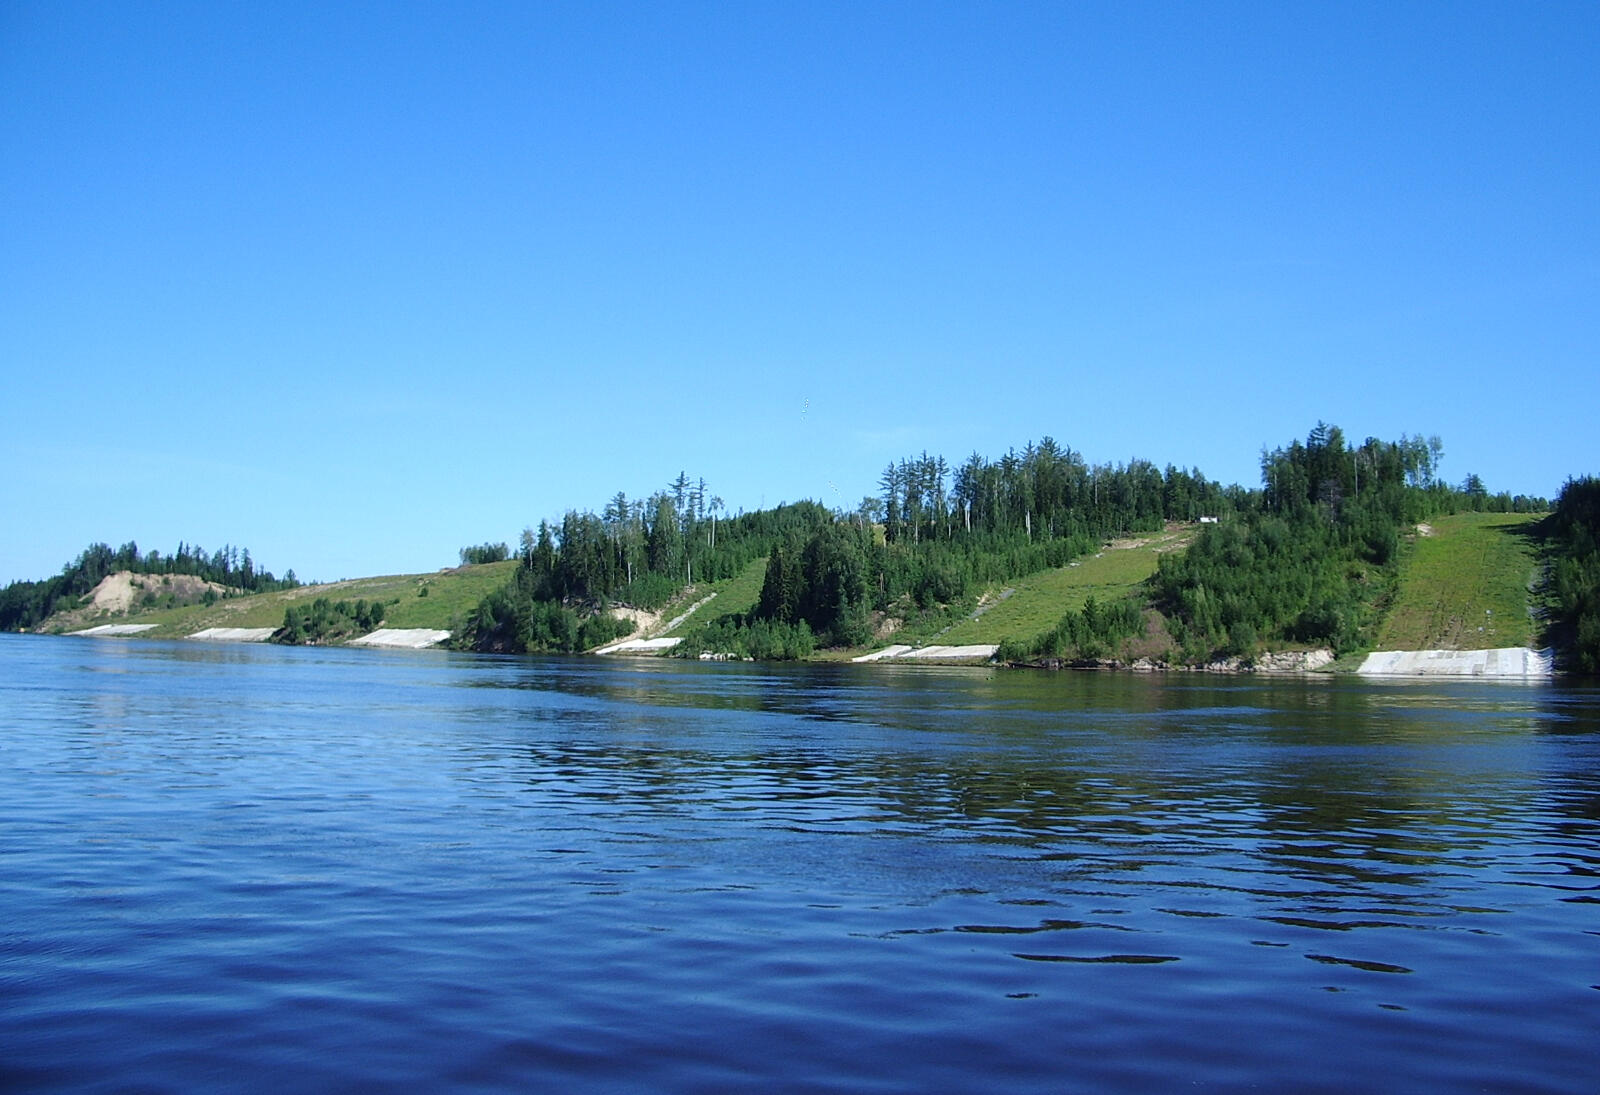
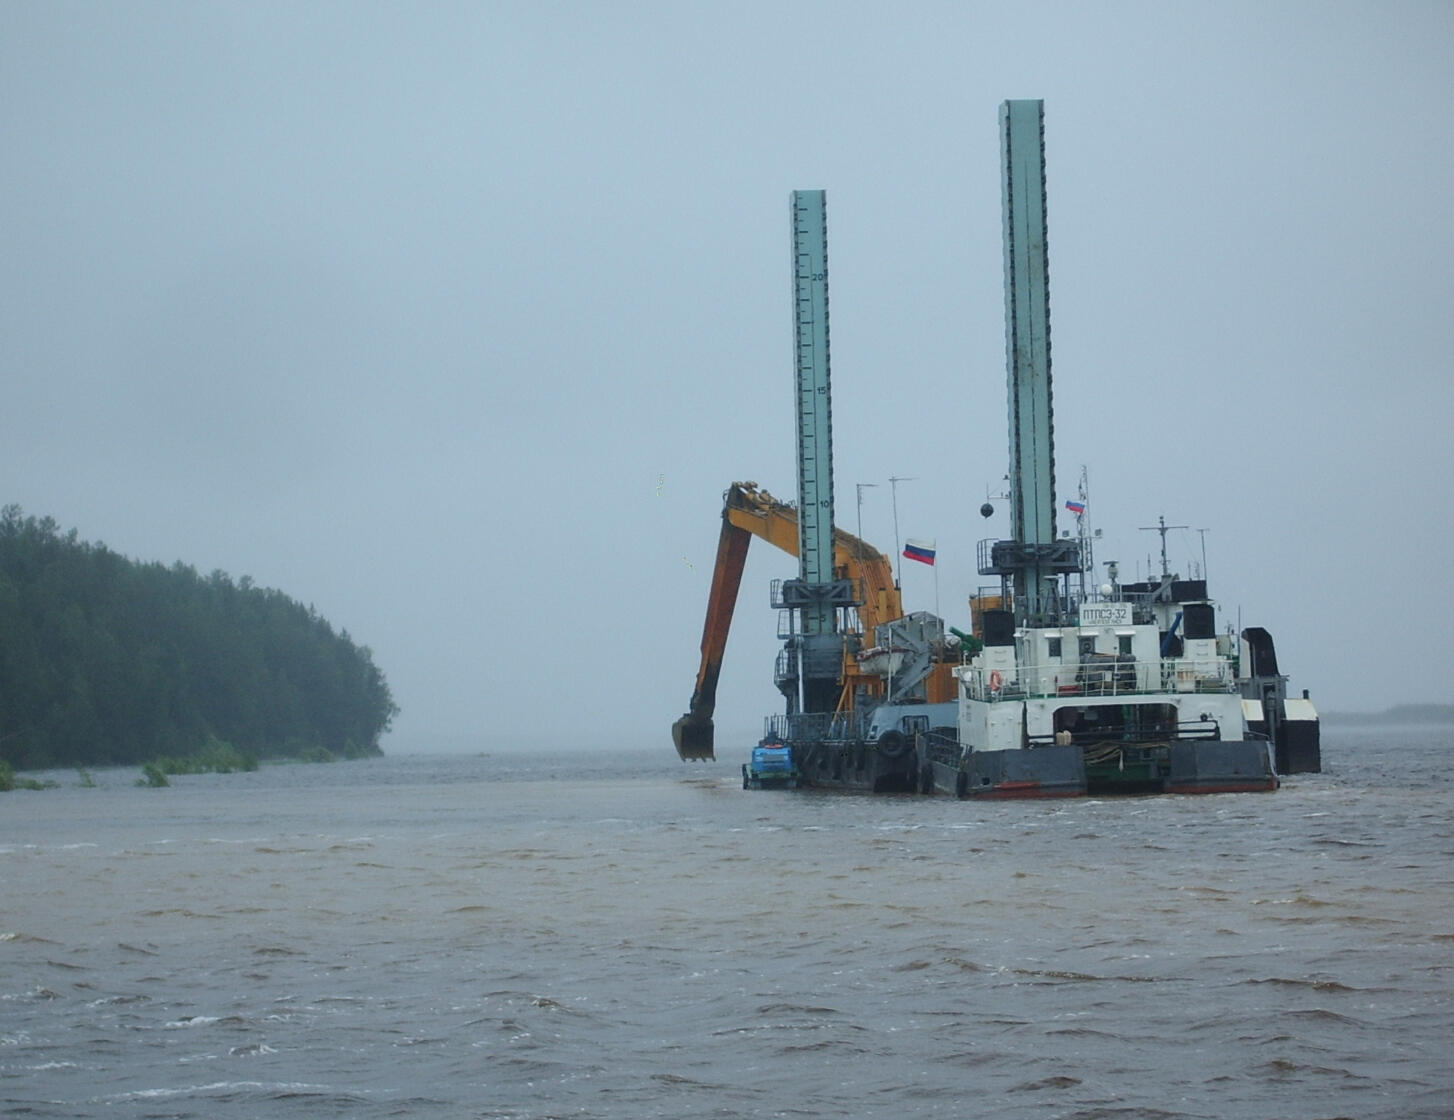
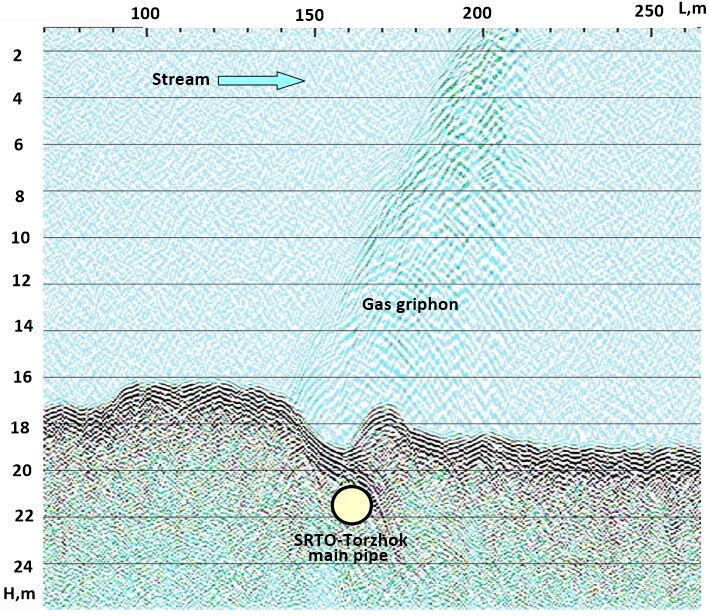
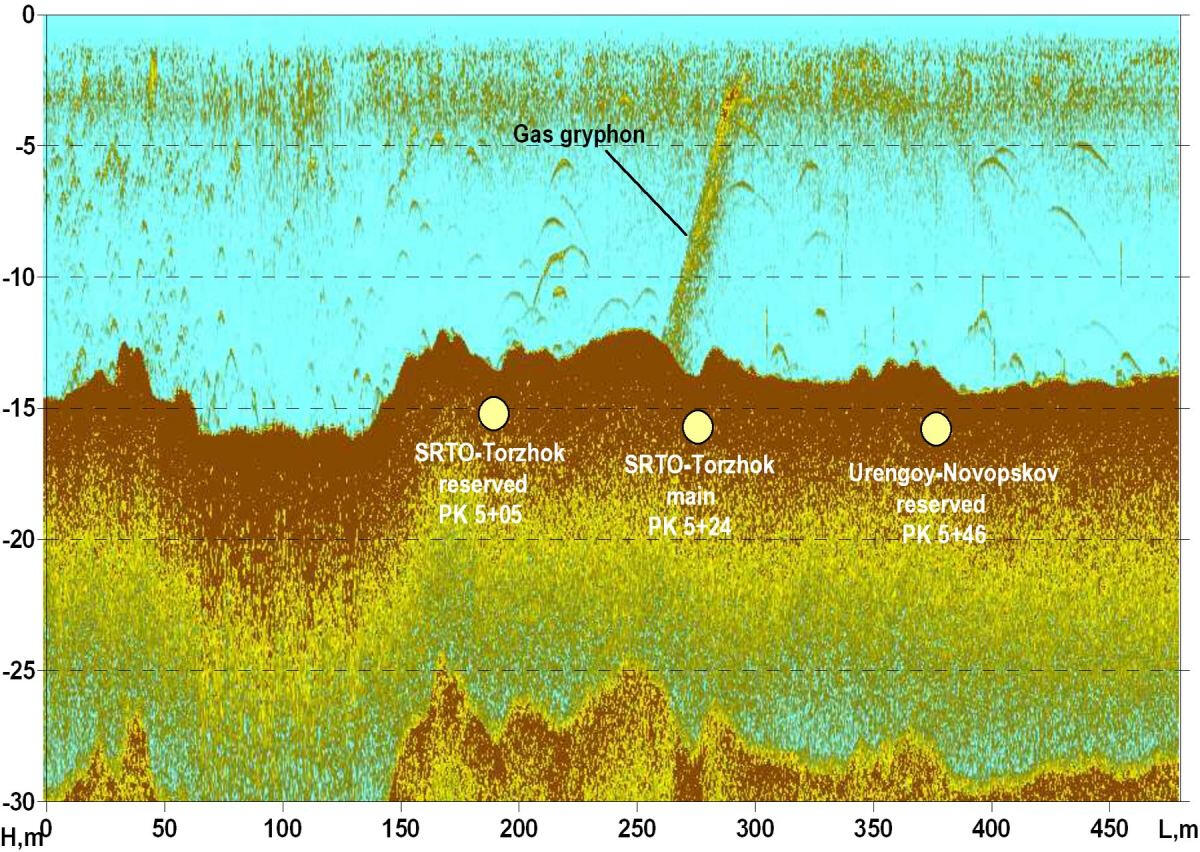
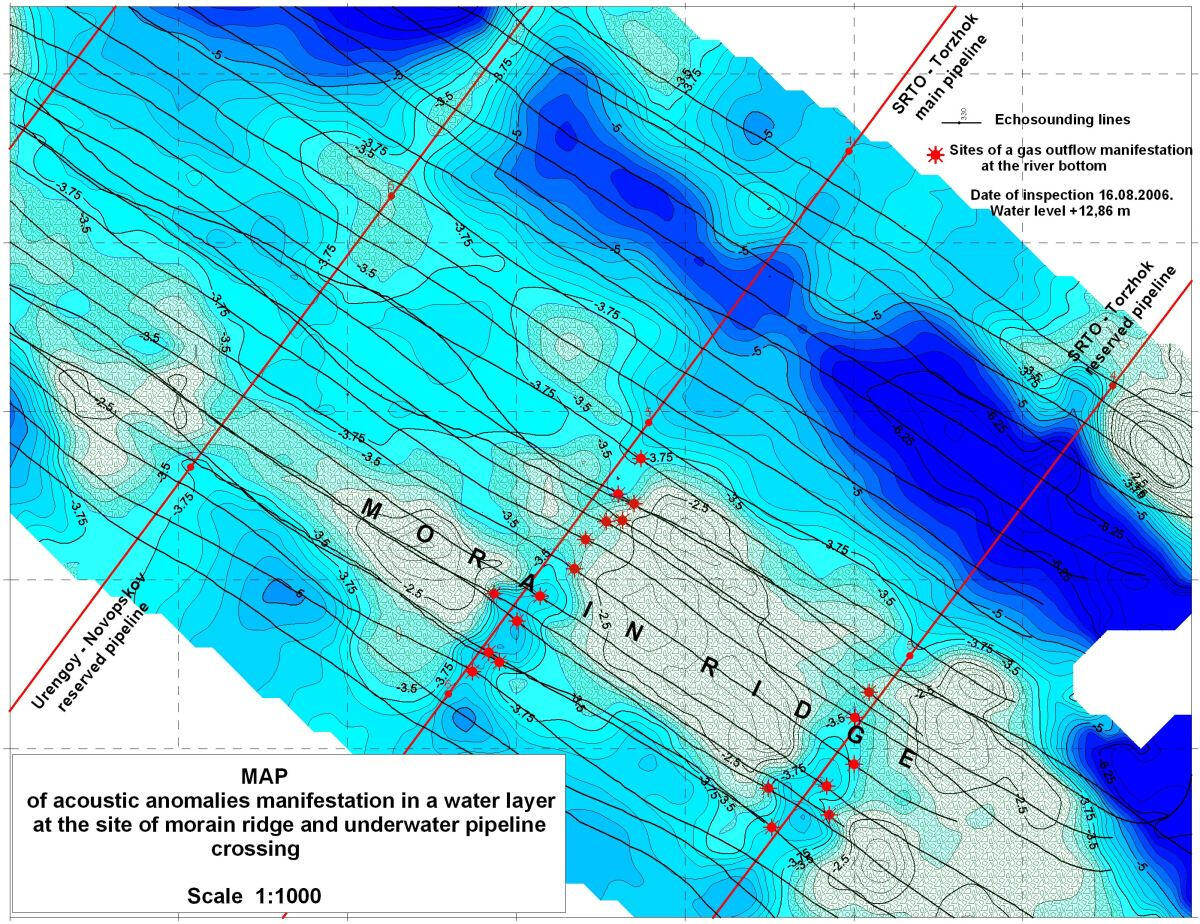
Object characteristics
The work was carried out on the section of underwater crossings across the Ob River of the main gas pipelines from Siberia to Europe near the settlement of Peregrebnoye (Western Siberia). The width of the river on the crossing section is about 2 km, the depth is up to 16-22 m depending on the season. For 12 years, various organizations monitored the conditions of the pipelines on the river bottom using geophysical methods on this section of the underwater crossing, 1.8 km wide. For the first time, anomalous phenomena on seismoacoustic records associated with gas shows were discovered after laying two new pipelines with a diameter of 1420 mm in the upstream part of the corridor.
.
Bottom soils in the transition area
The river bed is composed of sand deposits in the form of ridges up to 4-5 m high, moved by the river current. To lay the pipelines along the river bed, trenches up to 5 m deep were dug with backfilling of soil. In the middle part of the river bed, in the cross-section of two new pipelines, there is a moraine ridge up to 4 m high. Here, a floating excavator was used to dig trenches in dense moraine loams with a large number of large debris and boulders.
.
Wave pattern anomalies in seismoacoustic records
Anomalies in the wave pattern on seismoacoustic profiles were noted at the points of their intersection with the new pipelines. However, the resolution of relatively low-frequency seismoacoustic records (about 2.5 kHz) did not allow for precise determination of the locations of gas leaks on the bottom.
.
Displaying gas emissions on echo sounder records
There was a possibility that the gas leaks were associated with minor damage at the joints of new gas pipelines. For more accurate localization of gas leaks into the water layer, echo sounding was performed using an LMS-337C DF echo sounder with a frequency of 50 kHz along a dense network of profiles with a distance of 5 m between them.Echo sounding is one of the main methods for studying the bottom condition of a reservoir at an underwater crossing. Its data are used to determine deformations of the river bottom relief as a result of active lithodynamic processes and man-made impacts on pipeline routes. Processing echo sounder records using specialized software allows us to identify possible gas leaks into the water layer. The provided echo sounder section clearly shows the details of the moraine ridge surface relief, a gas griffin deviating under the influence of the river current, as well as small diffractions associated with reflections from air bubbles of large fish.
Localization of gas emissions from bottom soils along pipelines
Accurate referencing of gas emission points into the water layer, together with detailed bottom relief survey, allows us to determine the sources of leaks. According to echo sounding survey data, gas leak points are traced along trenches where they intersect the moraine ridge. In order to identify the connection between the intensity of gas manifestations and leaks from pipelines, the pressure in the pipes was reduced threefold, from 75 to 25 bar, in agreement with the management of the gas compressor station. However, no decrease in the intensity of gas manifestations was detected.Since the intensity of the gryphons remained unchanged with a significant decrease in pressure in the pipes, the gas manifestations were most likely of a geological nature and were associated with accumulations of methane or carbon dioxide in the soils under the dense loams of the moraine ridge that were discovered during trenching.
Thermal power plant TEC-2 (Riga)
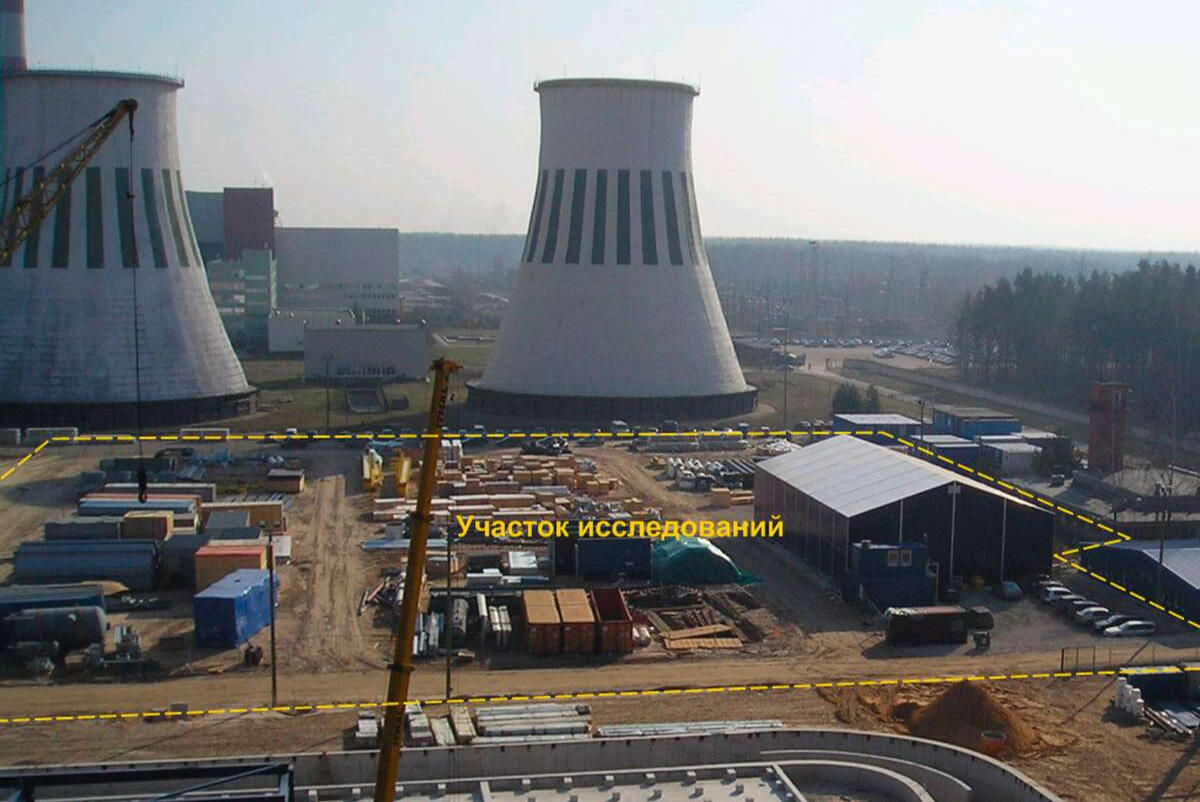
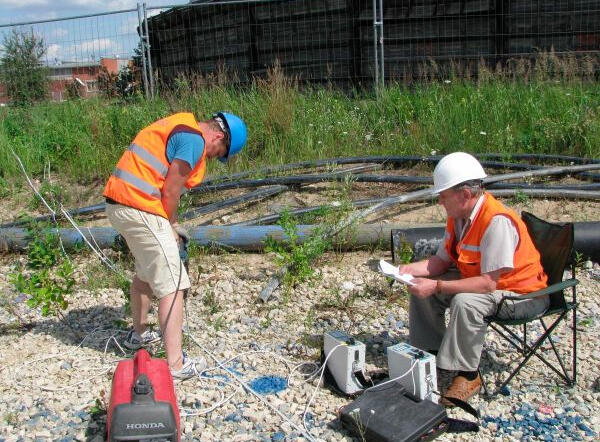
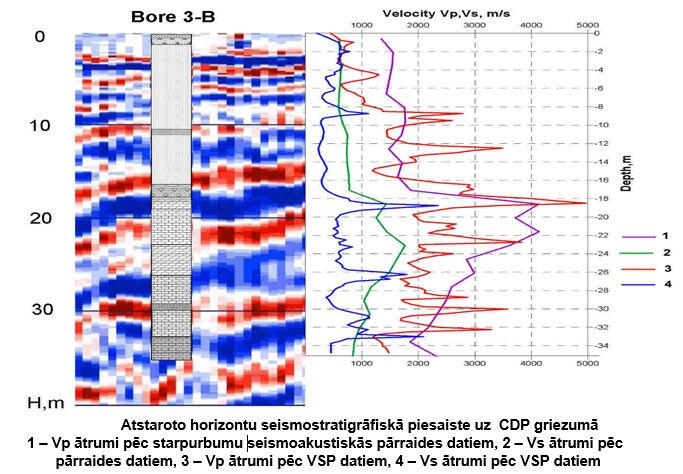
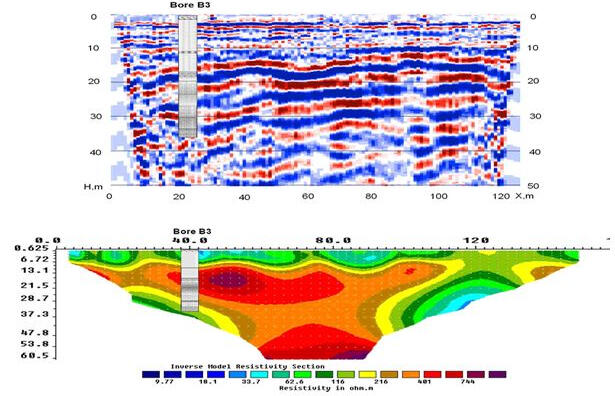

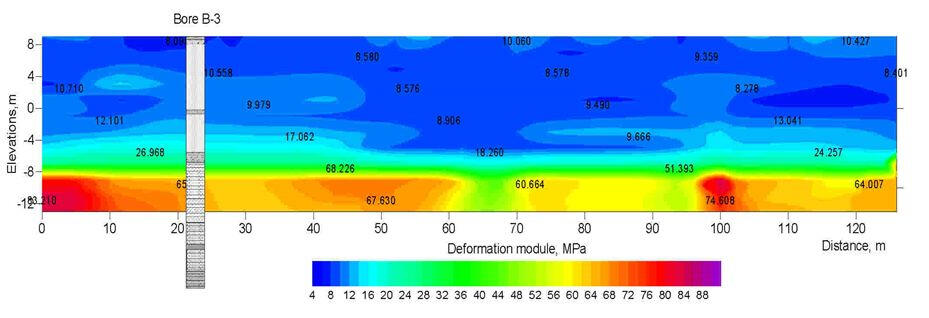
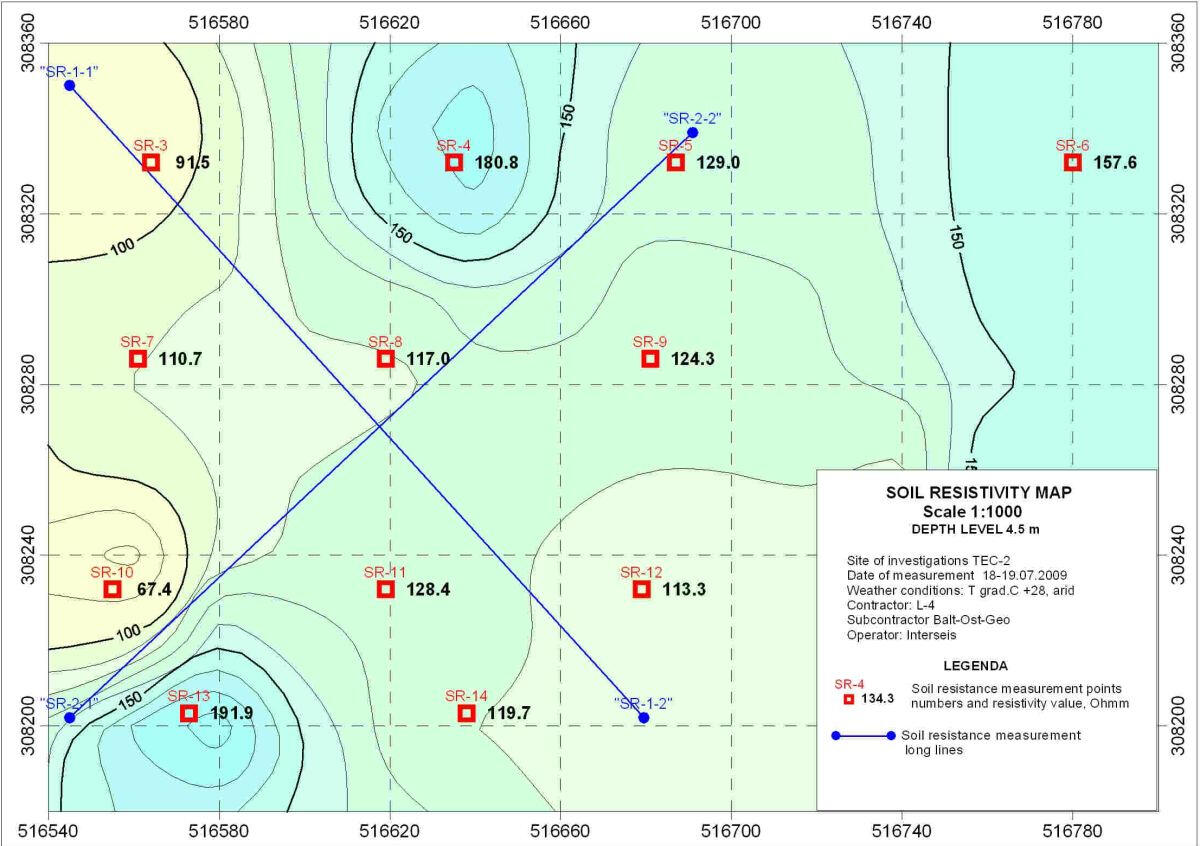
View of the construction site during engineering surveys
The objectives of the work were:
- conducting interborehole seismoacoustic scanning in a group of three geotechnical boreholes 35 m deep and located at a distance of 3 m from each other;
- measuring the electrical resistance of the upper part of the soil massif at 12 points;
- measuring the electrical resistance of the deep parts of the soil massif on diagonal lines 200 m long.Additional studies were carried out in the following volume:
- longitudinal vertical seismoacoustic profiling (VSP) in the central geotechnical borehole;
- non-longitudinal vertical seismoacoustic profiling from the point of the southern geotechnical borehole to the central borehole of group B-3 at a distance of 3 m;
- seismic profiling using the full depth point (FDP) method using reflected waves along a profile oriented from west to east;
- seismic profiling using the refracted and surface waves;
- multi-electrode impedance profiling (electrical tomography)
Seismic profiling and electrical logging of the upper soil layer
Geophysical profiling works using shallow seismic exploration and electrical tomography were carried out in combination with acoustic scanning and VSP in three boreholes located in the center of the study area. The results of geotechnical drilling and static sounding were used to interpret the seismic data.
.
Predictive assessment of physical properties of soils based on longitudinal and shear wave velocities.
The obtained velocities Vp and Vs were used to calculate the predicted geotechnical parameters of soils and bedrock. Density and Poisson's ratio were calculated for all depth intervals. For cohesionless quaternary soils, the total deformation modulus, internal friction angle, and specific cohesion were calculated. For bedrock, the elastic constants were calculated: Young's modulus, shear modulus, and bulk modulus.
.
Mapping of the surface of moraine and bedrock sediments using the method of reflected waves and electrical resistivity tomography.
Seismic profiling was carried out using the methods of reflected, refracted and surface waves. Average elastic wave velocities were used according to the VSP data in the center to construct seismic sections on a depth scale.
Calculation of predicted values of density and deformation parameters of soil and bedrock
Calculations of physical parameters, deformation parameters and elasticity were carried out using the following relationships:
Bulk density: ρ = 1.2475 + 0.399 Vp – 0.026 Vp2
For alluvial and deluvial loams:
Deformation modulus E = 83.53 - 145.7 Vp +64.15 Vp2
Angle of internal friction φ = -151.5 + 194.5 Vp – 52.05 Vp2
Specific cohesion C = 0.03944 – 0.06583 Vp + 0.2861 Vp2
Porosity m= 0.6482+ 0.05569 Vp - 0.1307 Vp2
Map of specific electrical resistance values soil at a depth of 4.5 m according to micro-VES data
To optimally place electrical groundings, electrical resistance maps were constructed at a depth of 1.5, 3.0, 4.5 and 6.0 m. Resistance data were obtained at several points on the construction site using the micro-VES method with a supply electrode distance of up to 18 m. To link the electrical tomography data obtained along the profiles along with shallow seismic exploration data, VES were performed along two perpendicular lines up to 200 m long.
Southern bridge over the Daugava river (Riga)
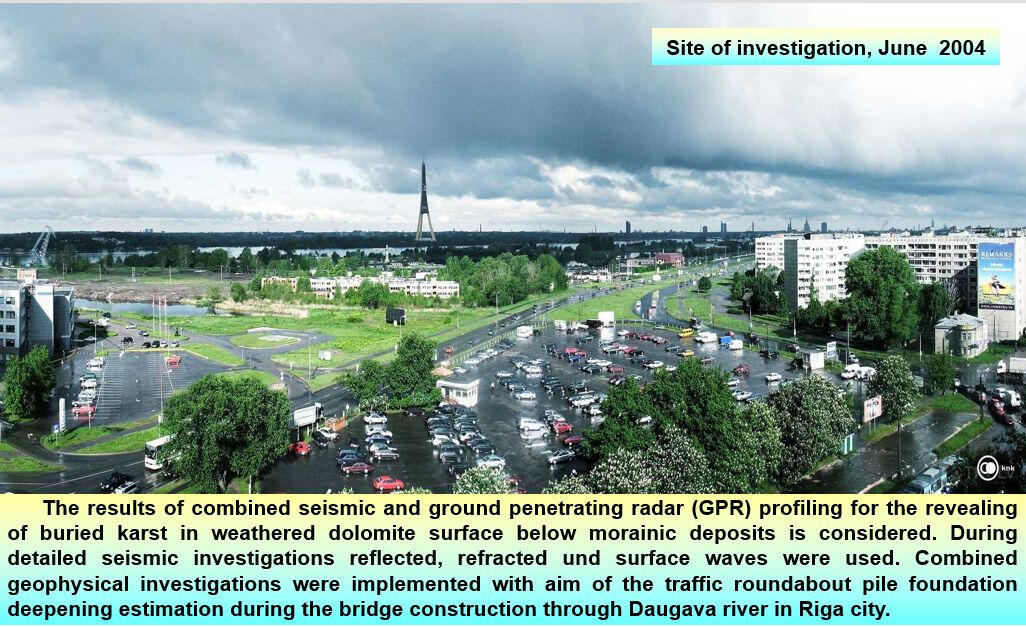
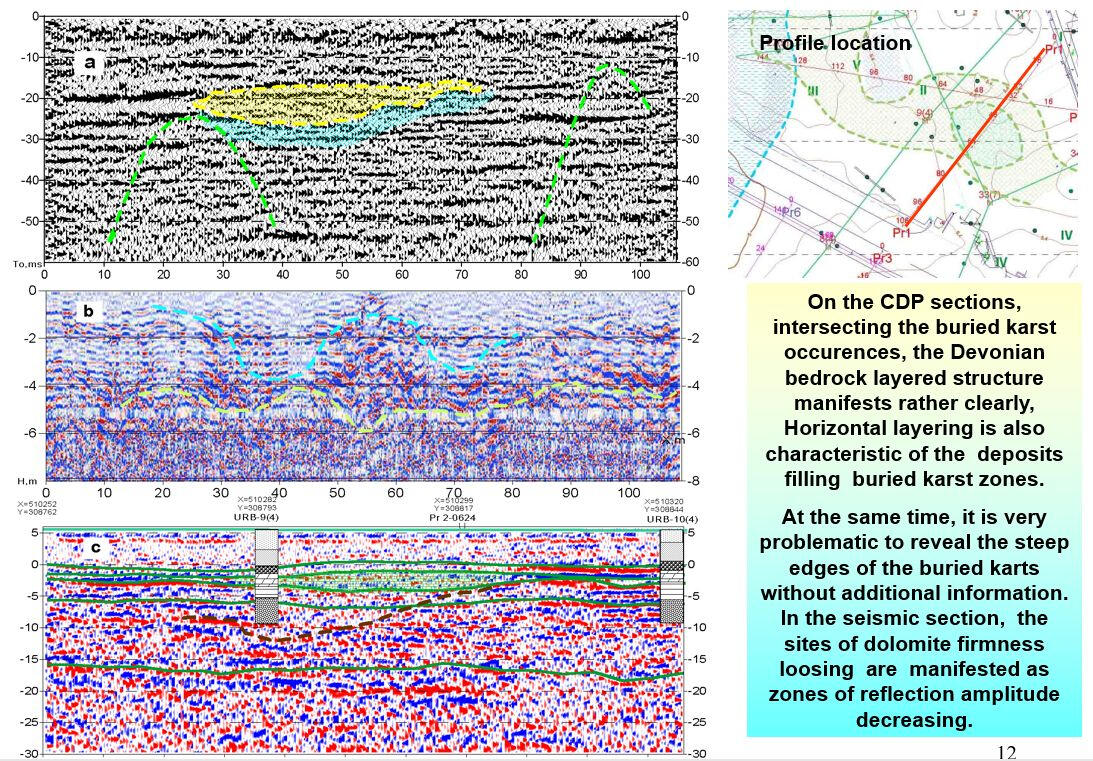
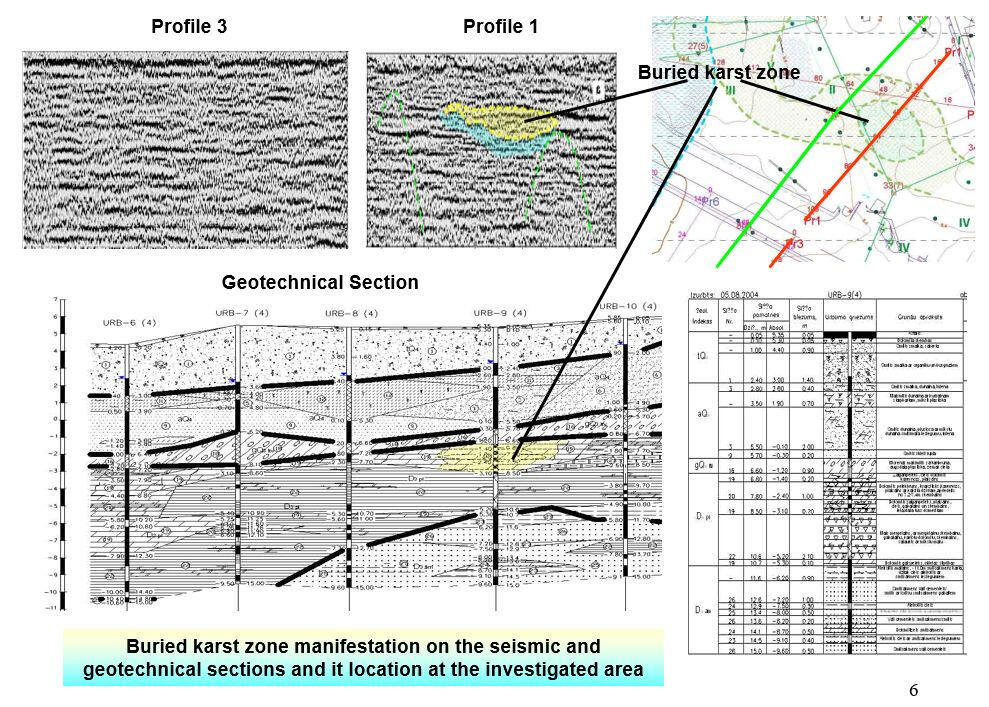
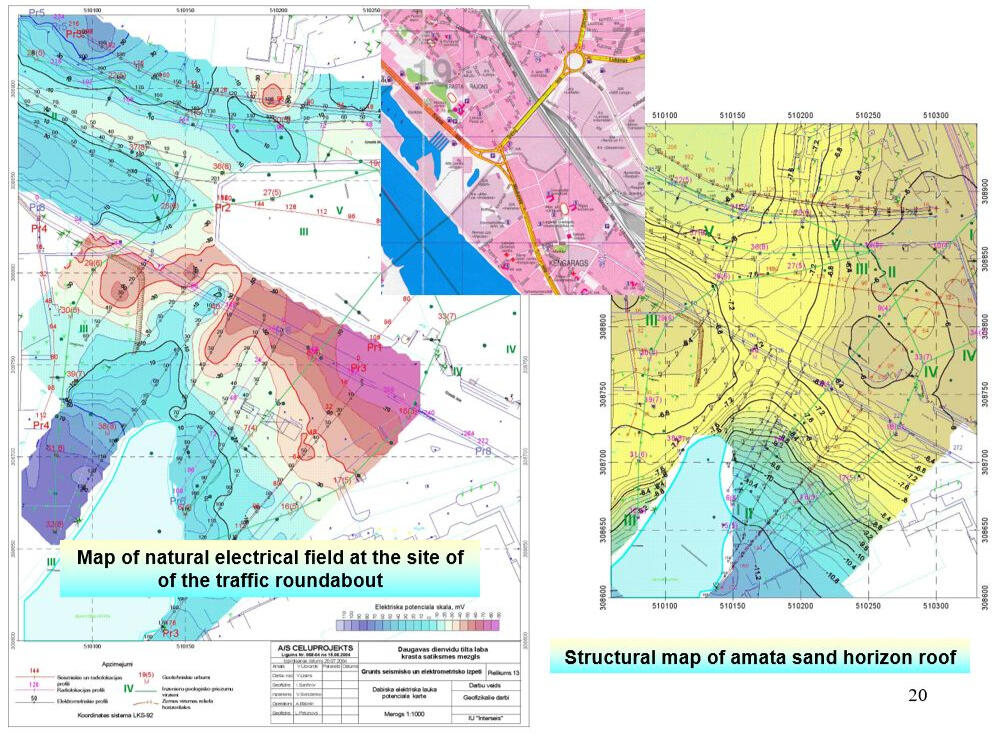
Seismic prospecting, GPR and natural electric field surveys
Work on the site of right bank interchange of designed South bridge over the Daugava river in Riga is made by seismic methods of reflected and refracted waves, GPR and resistivity sounding method of natural field (SP). To interpretation of geophysical data the results of the geotechnical drilling of JSC "Ceļuprojekts" were involved. As a result of the performed investigations in places of a number statement of the three-level traffic intersection support the manifestations of the buried karst in the bedrock Dolomites lying under a layer of dense moraine loams are revealed.
.
Manifestations of palaeokarst on the GPR and seismic profiles on one of the interchange lines
Karsted dolomites in the construction site occur at a depth of about 6 m and overlapped by alluvial sediments and bulk soil with a capacity of 4-5 m, underlain by a layer of thick moraine loams with a capacity of up to 1.5 m. Figure shows a typical manifestation of karst areas on seismic and GPR sections.
The interpretation of the manifestations of palaeokarst on the seismic time sections
To interpret the data, the following were obtained:
- seismic sections on the time scale of the sweep;
- radar sections on the depth scale;
- sections of average velocities along seismic profiles on the scale of double travel time of reflected waves;
- seismogeological depth sections;
- sections of the propagation velocities of longitudinal waves along seismic profiles on the depth scale.All of the above materials and the data of engineering-geological drilling were used to interpret the complex of geophysical data. Based on the simultaneous analysis of seismogeological, engineering-geological studies and lithological sections of wells, seismostratigraphic complexes were identified, the boundaries of which are presented in seismic sections in the form of correlated axes of phase synchronization.
Map of the potential of the natural electric field and possible places of manifestation of the buried karst
Manifestations of palaeokarst at depths of 6-8 m and 10-12 m identified in the band width of 30-40 m, which extends across the construction site in the meridional direction. At the same time, one of the distinct anomalies shown in the figure on right correspond to the installation site of one of the highest supports of the second-level overpass.Further conducted natural electric field potential survey revealed in the band of palaeokarst manifestations elongated positive anomaly values of the gradient, the axis of which is directed towards the lake in the floodplain of the river. The anomaly is interpreted as related to underground seepage flow at the level of the bedrock surface. According to historical data, in this place there was a small tributary of the Daugava river, now overlapped by bulk soils of urban development.
Plavinas hydroelectric power station - upper section of the reserve spillway (Latvia)
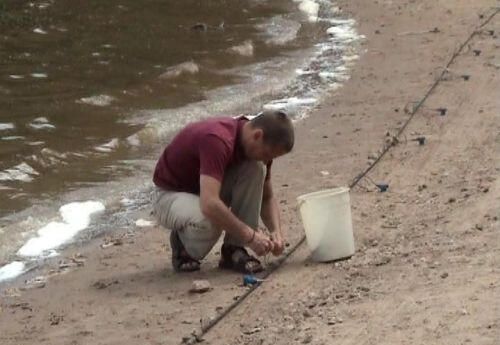
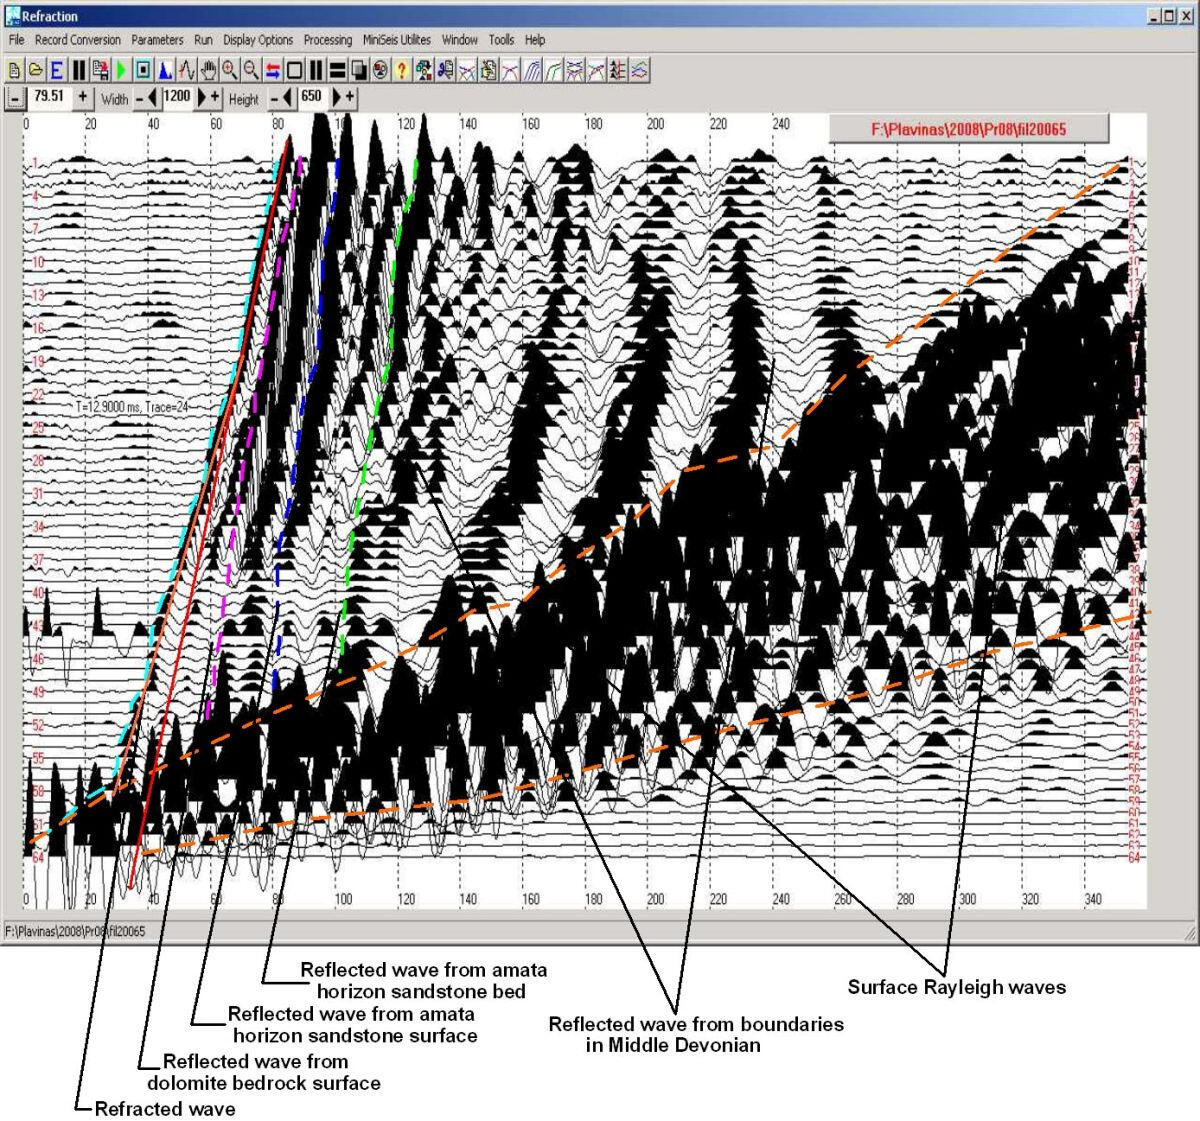
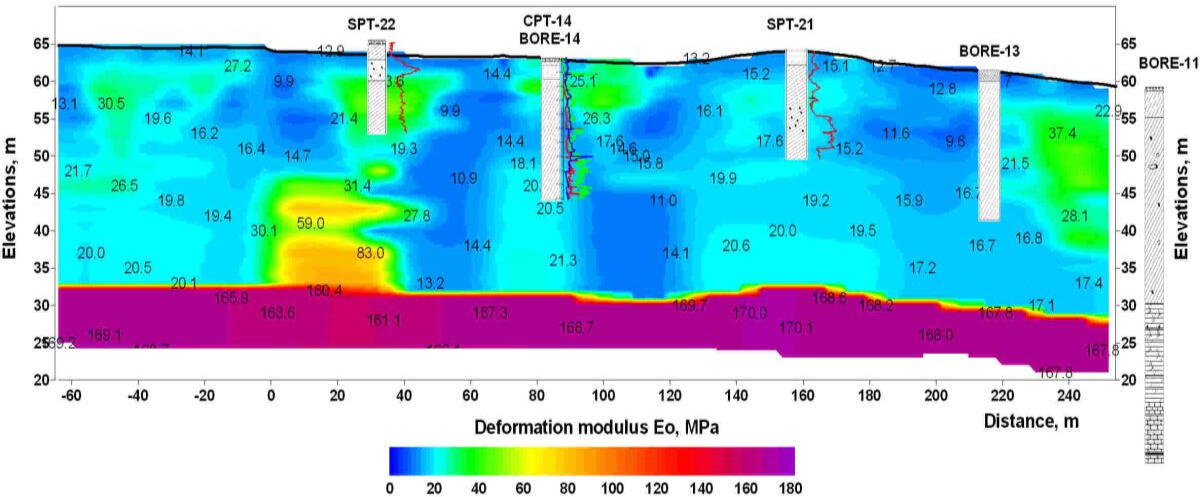
Dependence graph correction between the velocity of transverse waves and the standardized number of impacts N under standard (dynamic) testing in moraine soils
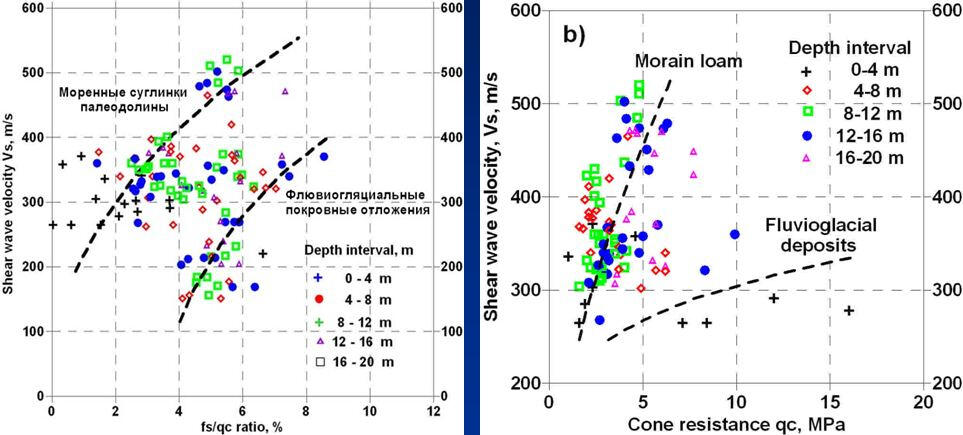
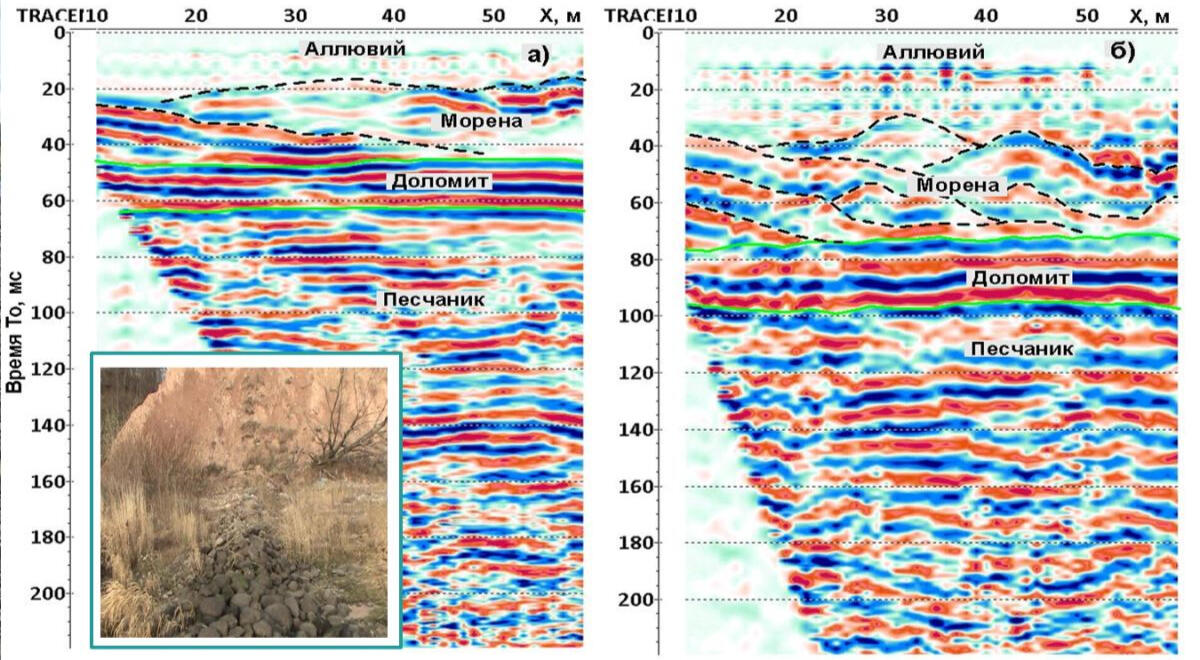
Reserve spillway - section of the water intake
Shallow seismics and electrometry by the method of electrical tomography on the planned route of Plavinas HPP reserve spillway was performed in combination with geotechnical drilling, cone penetration (CPT) and standard penetration (SPT) tests of soils. Seismic surveys were carried out by methods of reflected, refracted and surface waves using all types of elastic oscillations recorded on seismograms with vertical geophones and obtained with a single 32 or 64-channel geophone line with a step between the channels of 2 m.
.
The wave pattern on seismic records
On the upper part of emergency spillway the section is presented by a thick layer of morainic loam, filling the buried pre-glacial valley branch, and a layer of bulk soils of a protective dam and its base with thickness up to 16-18 m. In this regard, on the record clearly tracked refracted wave propagating along the surface of bedrock dolomites, the reflected waves from the boundaries in the Devonian sediments and series of intense low velocity and low frequency surface waves.
.
.
Section of predicted values of general deformation module of moraine soils on the axis of the middle part of reserve spillway
Direct calculations of elastic constants of the soil massif - Young's modulus of elasticity, shear modulus, and Poisson's coefficient - were performed on the base of longitudinal and transverse wave velocities. Predictive physical-mechanical parameters - soil density, module of deformation, angle of internal friction and specific adhesion was calculated using the known empirical dependences for particular soil types, adjusted by the co-processing of seismic data and cone penetration test data at the area of research.
Dependence graph correction between the velocity of transverse waves and the standardized number of impacts N under standard (dynamic) testing in moraine soils
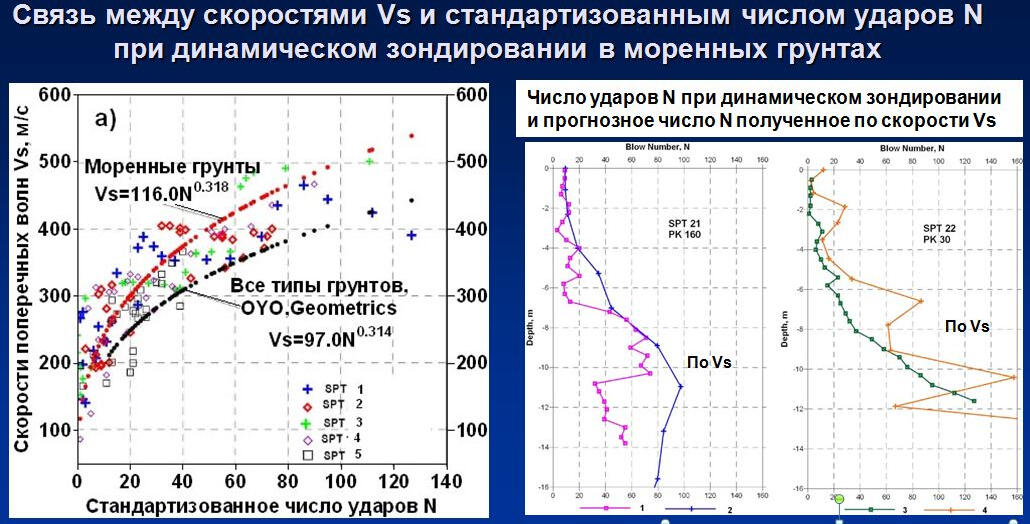
Time sections of reflected longitudinal (a) and transverse (b) wave methods
On separate sites of the seismic profiles to increase accuracy of the lower part of moraine soil section displaying, represented by ridges and coarse rubbly material, profiling performed using horizontal receivers of elastic waves. Transverse wave sections obtained from these records with a greater degree of detail reflected the structure of the moraine sediments lower interval with a capacity up to 10-12 m.
Plavinas hydroelectric power station - lower pool (Latvia)
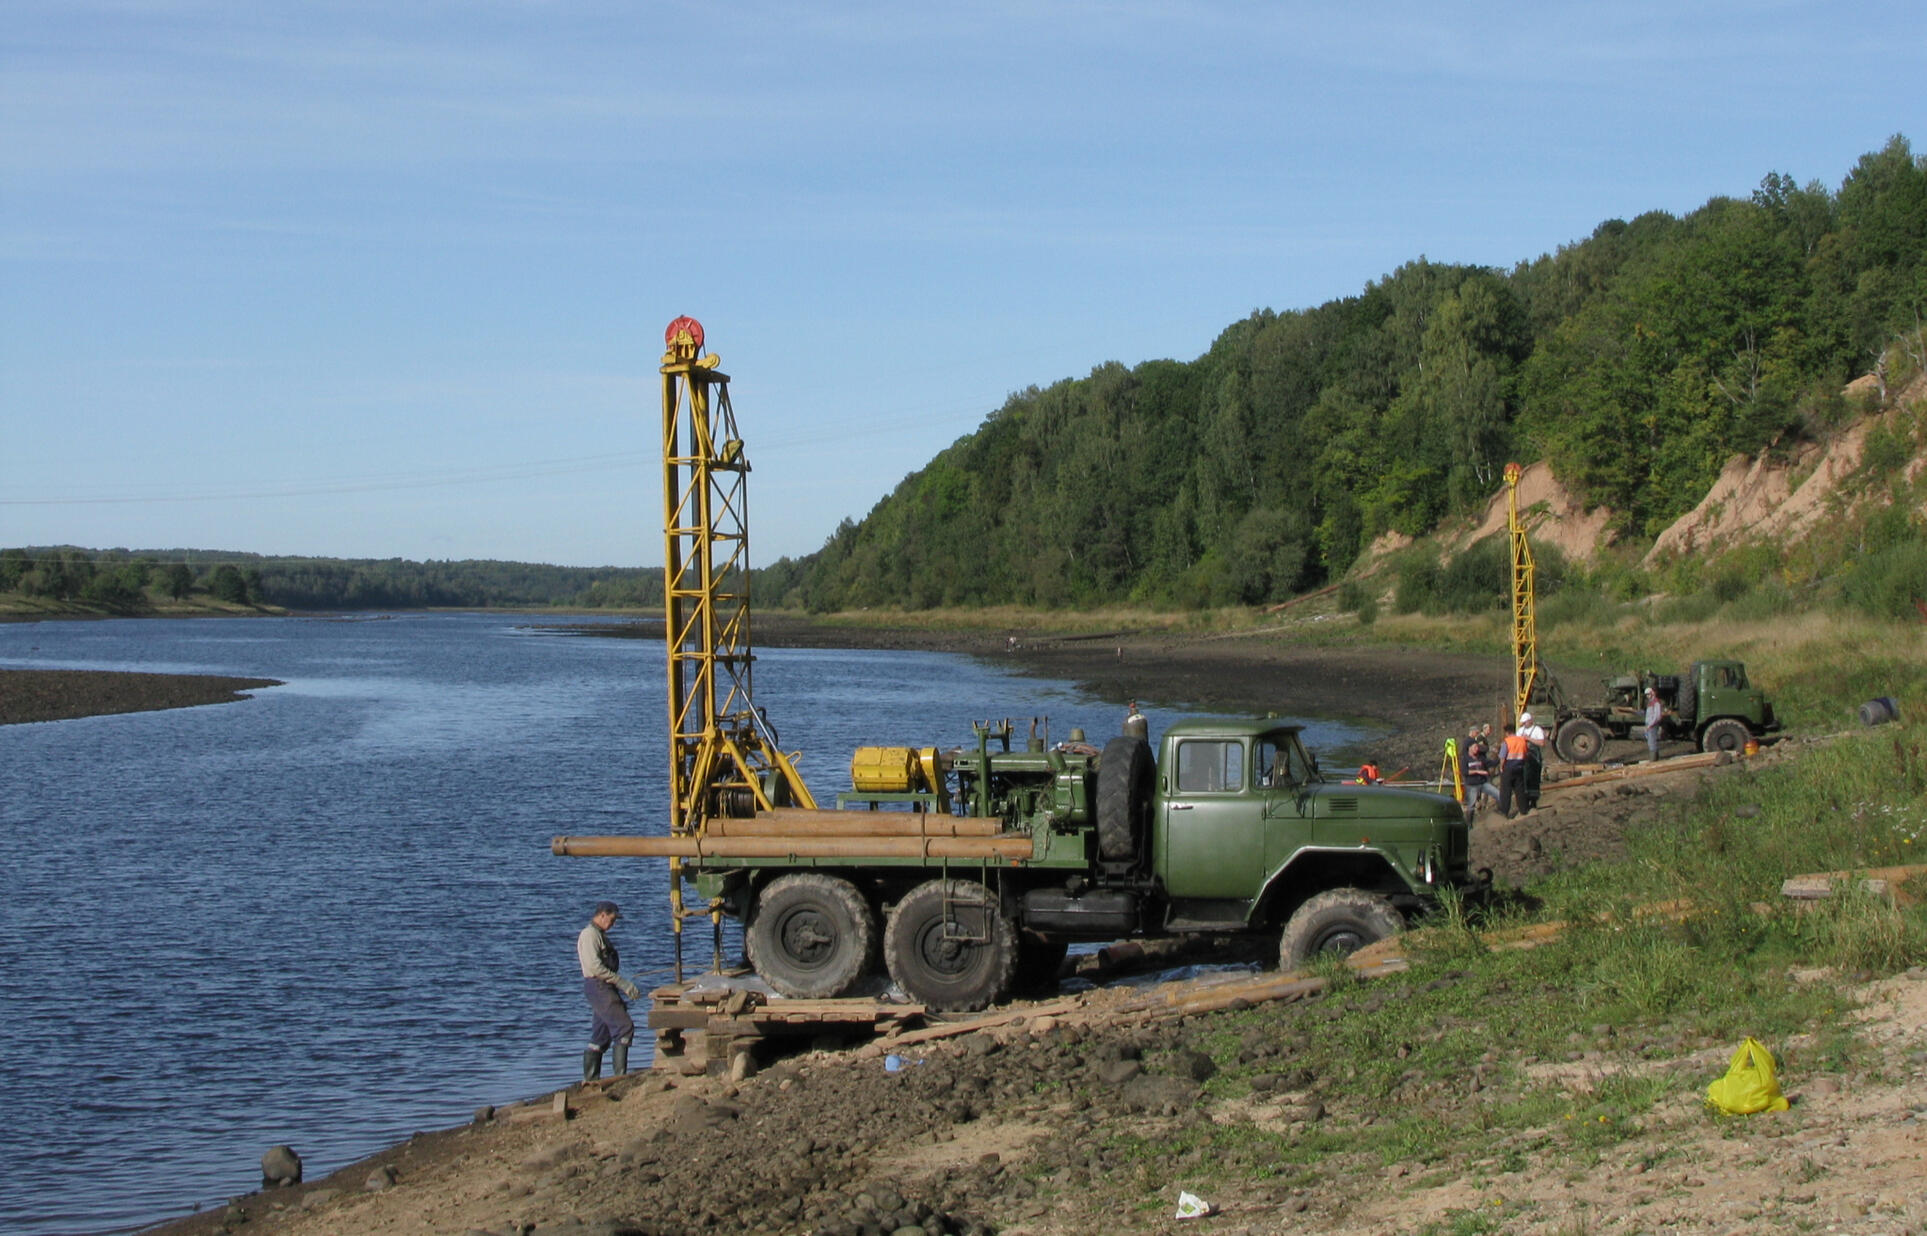
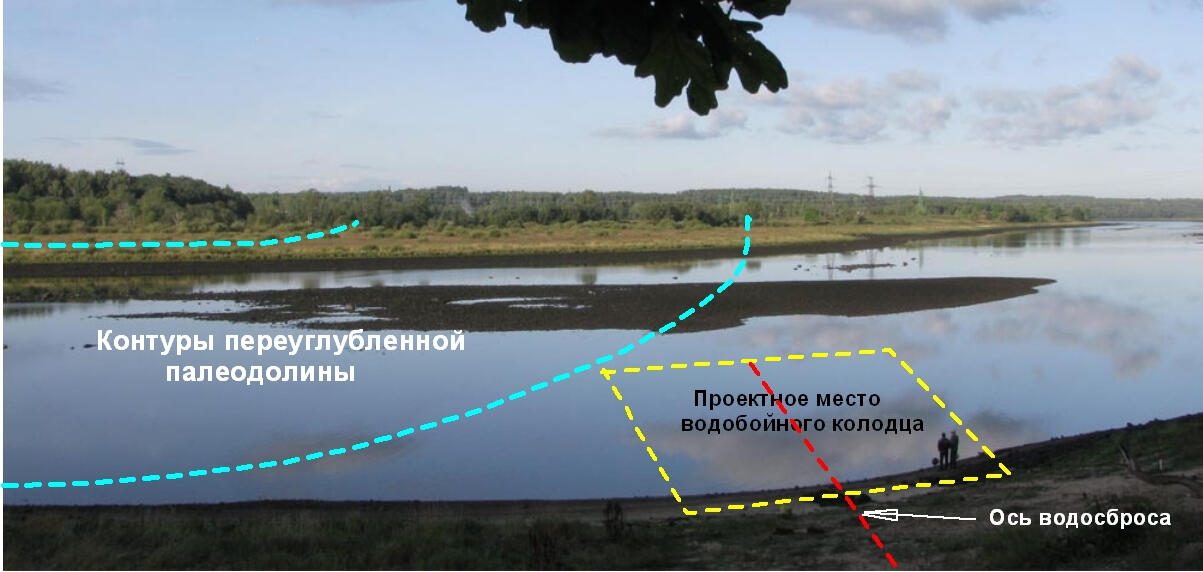
Section of longitudinal wave velocities along the axis of the emergency spillway through the bed of the duct
To determine the depth of the bedrock dolomite occurrence, longitudinal wave velocity sections calculated according to the method of refracted waves were used. The position of the dolomite surface in the dry part of the channel with a width of about 105 m is obtained from seismic records from the receiving geophone line located on the island and the excitation of oscillations on the shore.
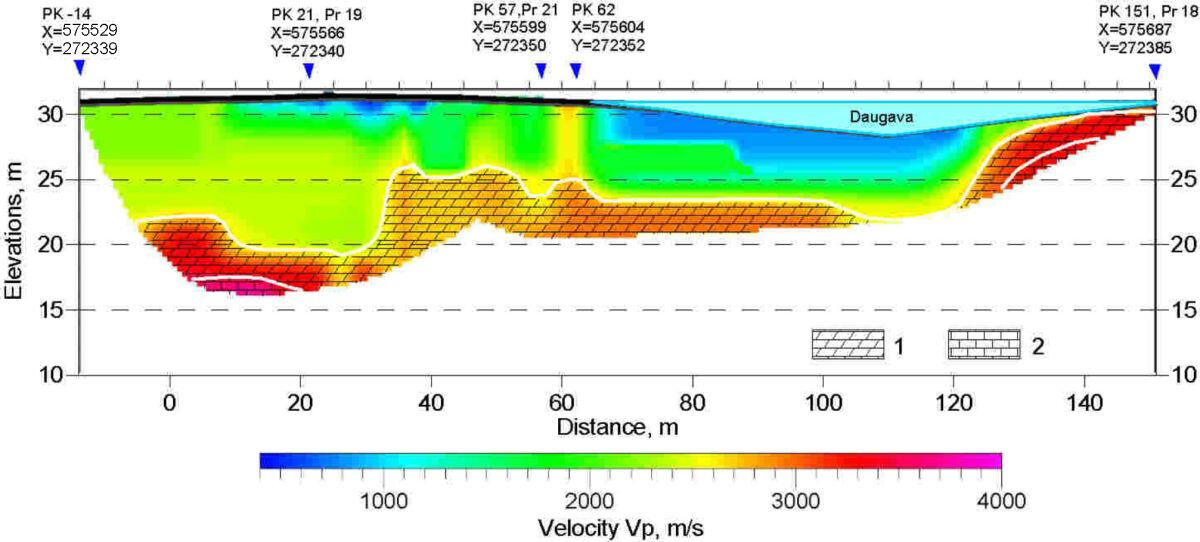
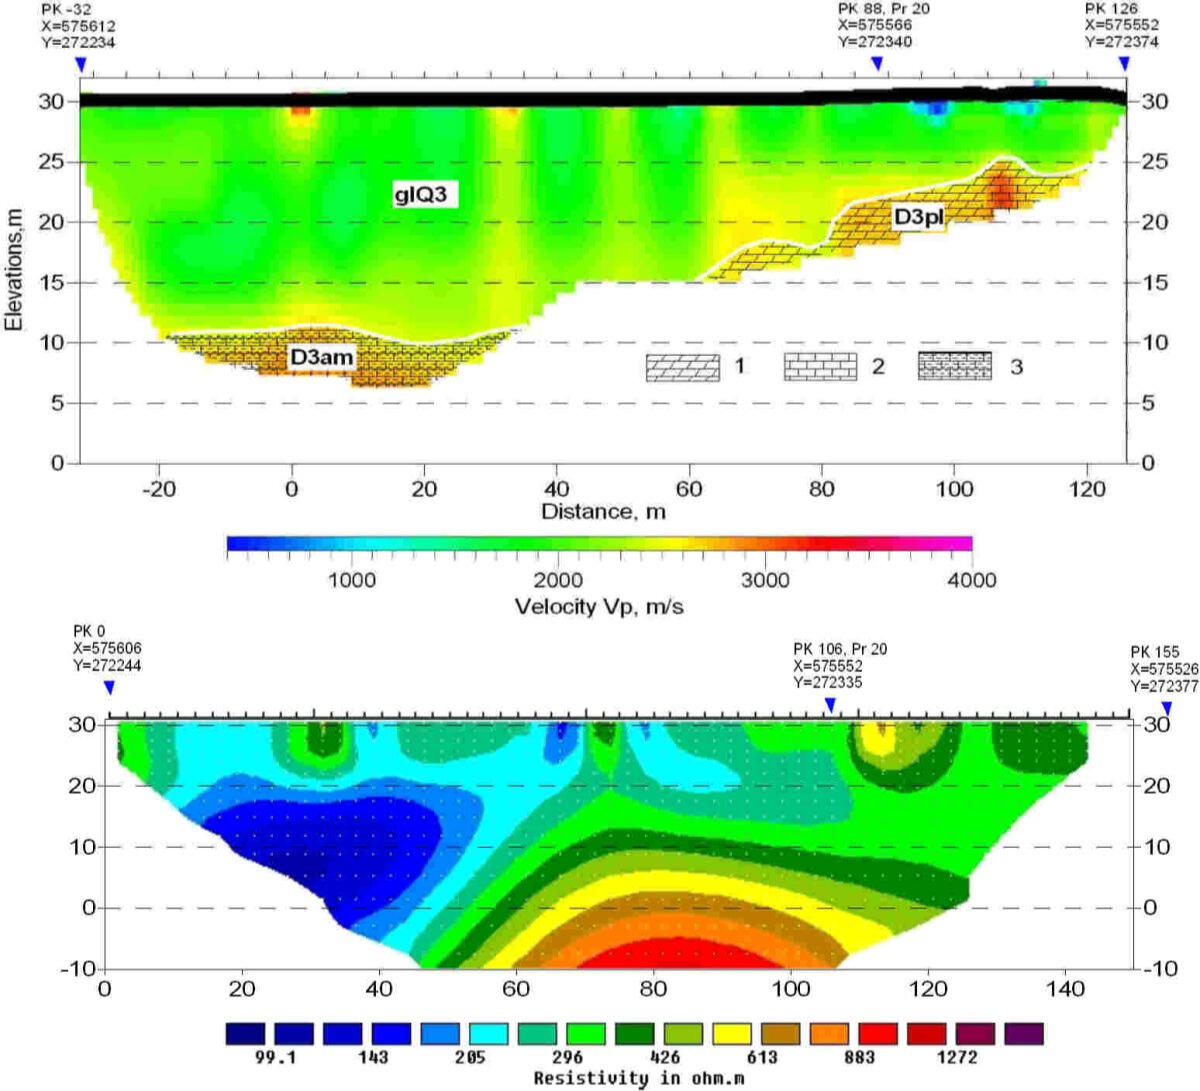
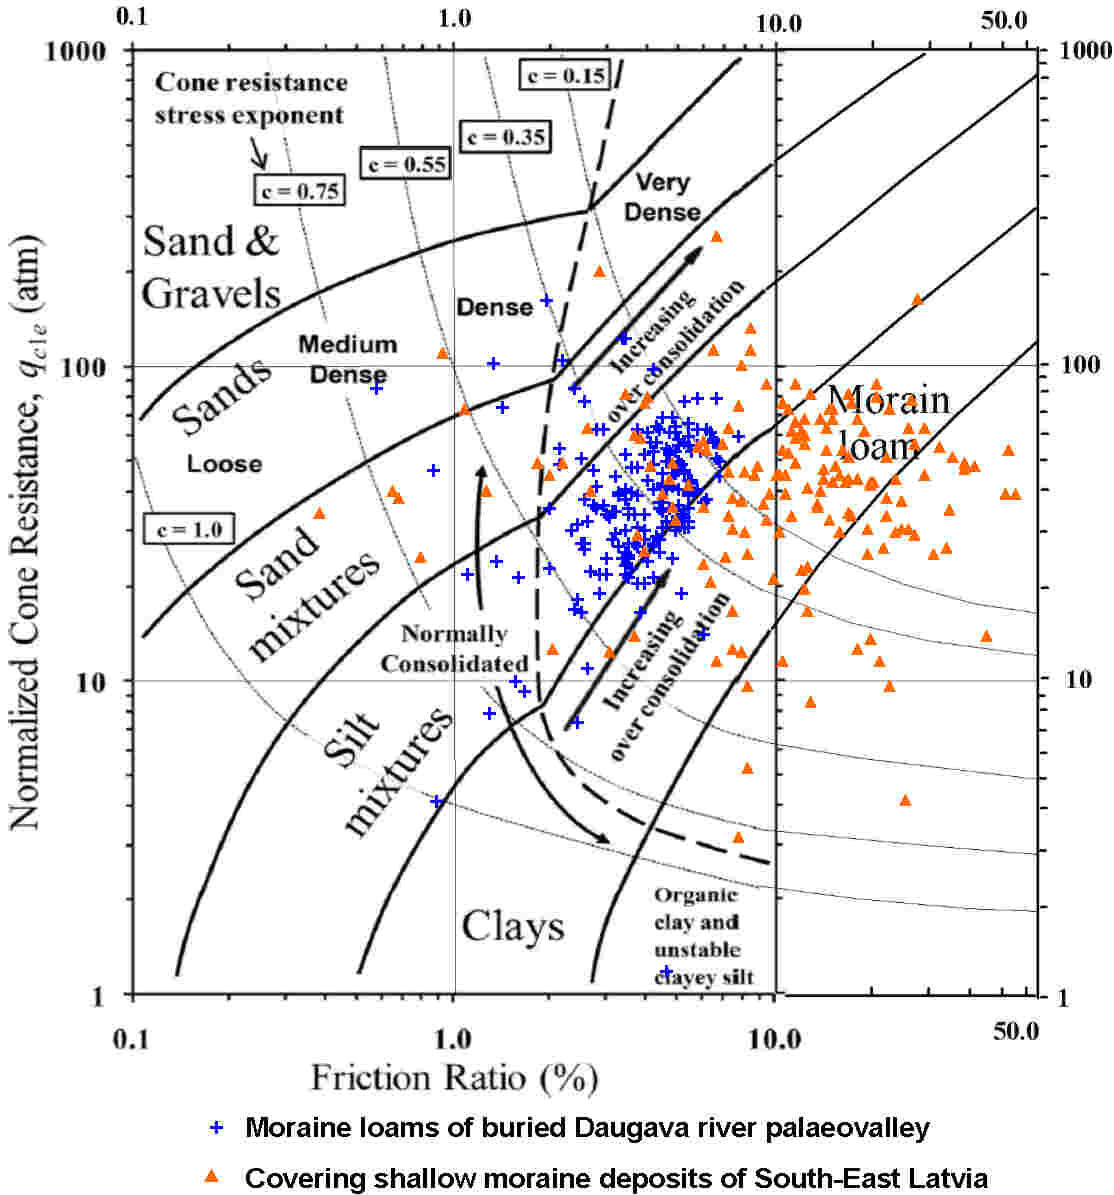
The lower area of the reserve spillway – water dropping sump
Work by methods of engineering seismic and electrical tomography performed on inaccessible for the drilling island site in the central part of the riverbed, drained while stopping the operation of the Plavinas power station and the lowering level of located below the cascade of reservoir of Kegums HPP.The main objective of the work was defining the contours of the edges of buried pre-glacial valley of Daugava river, cutting the Plavinas sediments of the upper Devonian bedrock dolomites through the construction site of the Plavinas HPP dam. The steep side of the valley, along which occur the landslide and karst processes and the increased rate of filtration of underground waters, are disadvantageous to device of heavy concrete foundations and walls of the water dropping sump.
.
Section of longitudinal wave velocities on the island section of the drained river bed
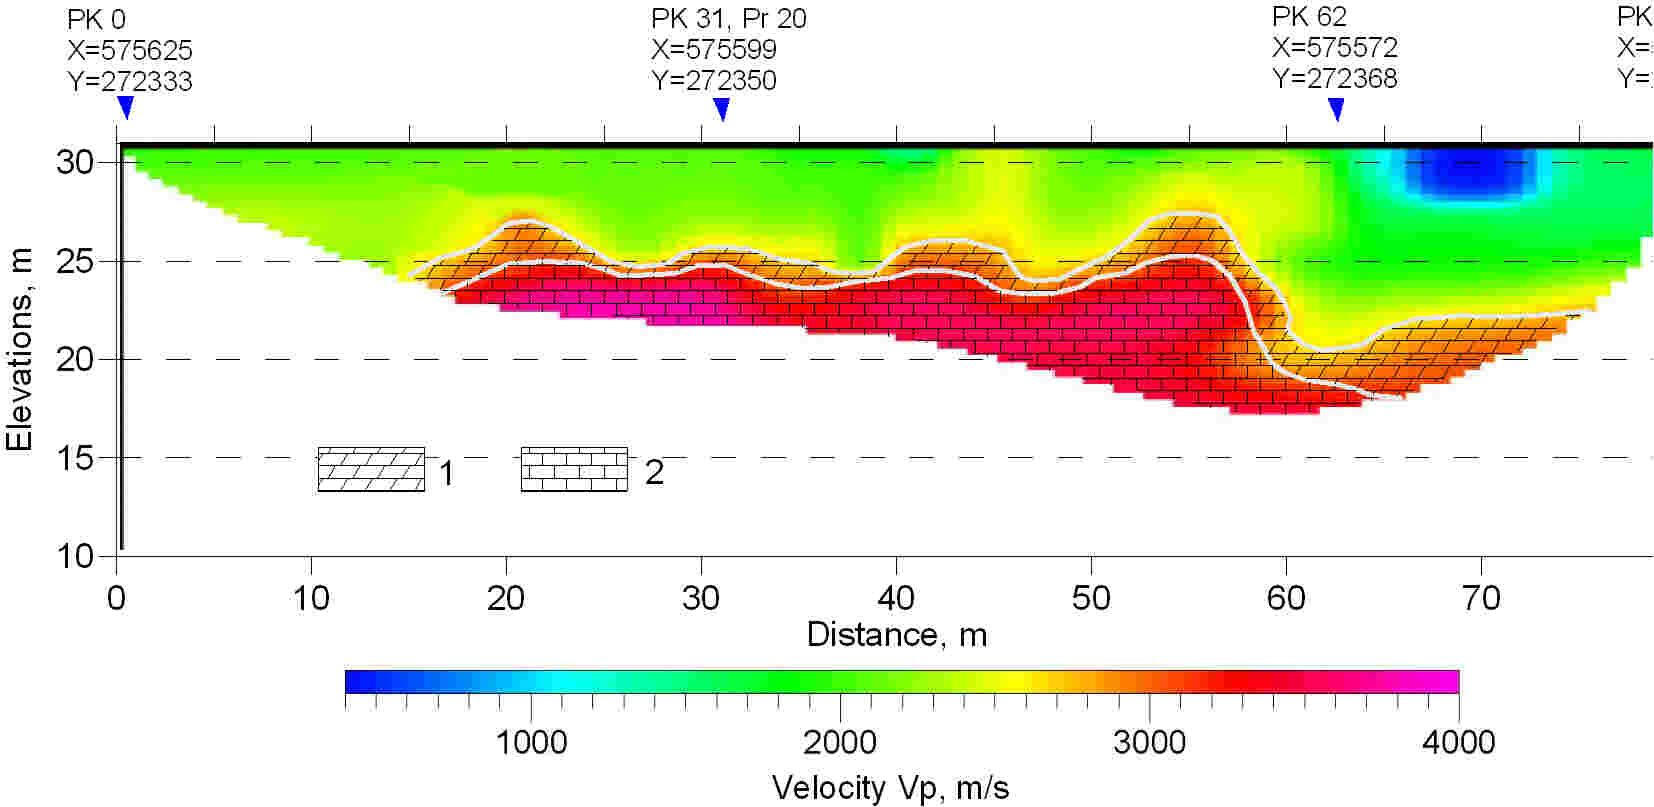
On palaeovalley edge the immersion of the roof of the dolomites more than 6 m is marked.
.
The section of longitudinal wave velocities along the profile oriented at an angle to the stretch of the valley side
The depth of the dolomite roof in the initial part of the profile reaches 20 m. Most immersed part of the valley filled with water-saturated moraine loam is also displayed on the geoelectrical section, obtained by electrical tomography.
.
Assessment of physical properties of moraine soils
By failing to achieve at the island area data of the cone penetration test and sampling for laboratory tests to classify types and evaluation of physical properties of morainic deposits, filling the valley, the modified Olsen nomogram was used taking into account statistical dependence and adjusted according to the geophysics and geotechnics on the banks obtained in local conditions.
Section of predicted values of the general deformation module of moraine soils on one of the profiles on the island
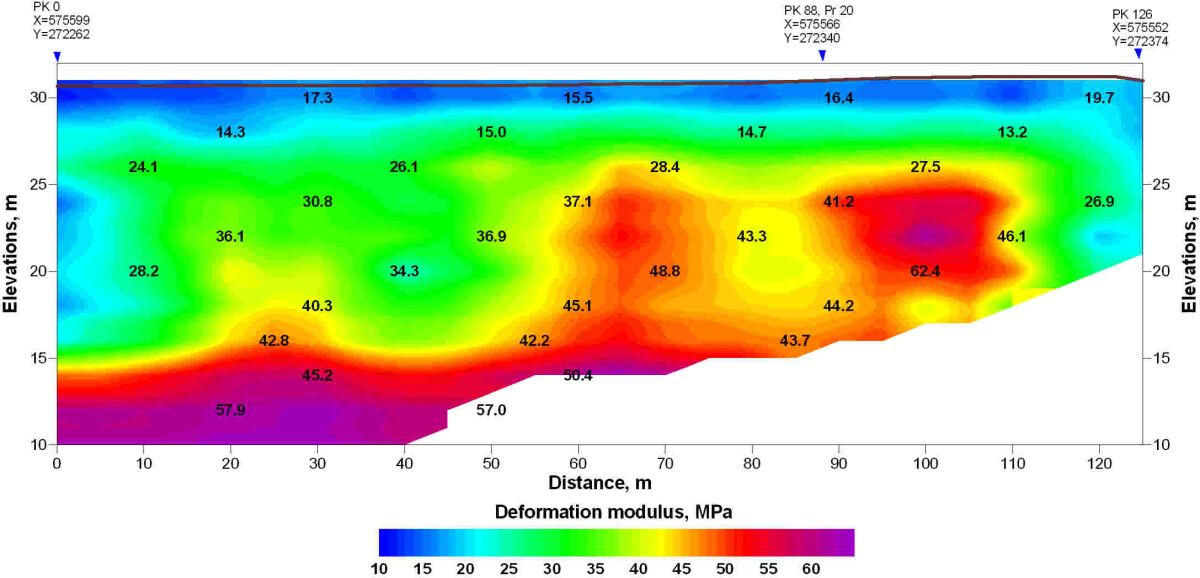
The berth of the passenger terminal of the port of Ventspils
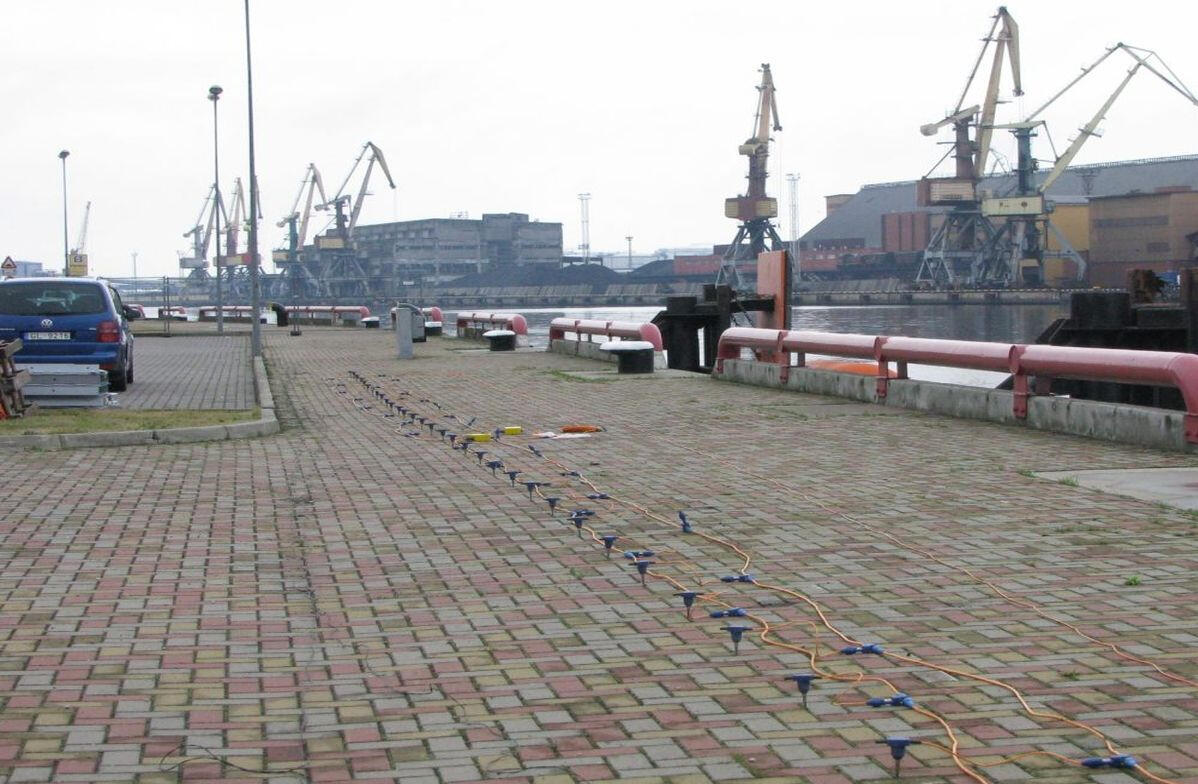
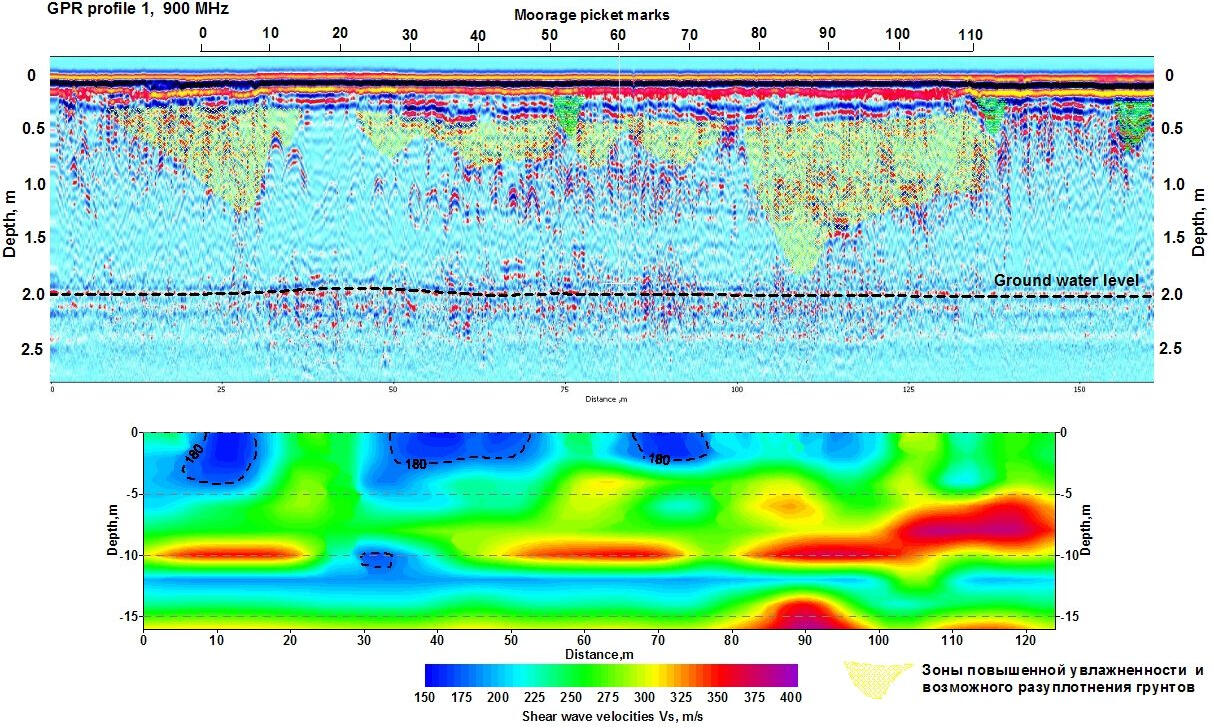
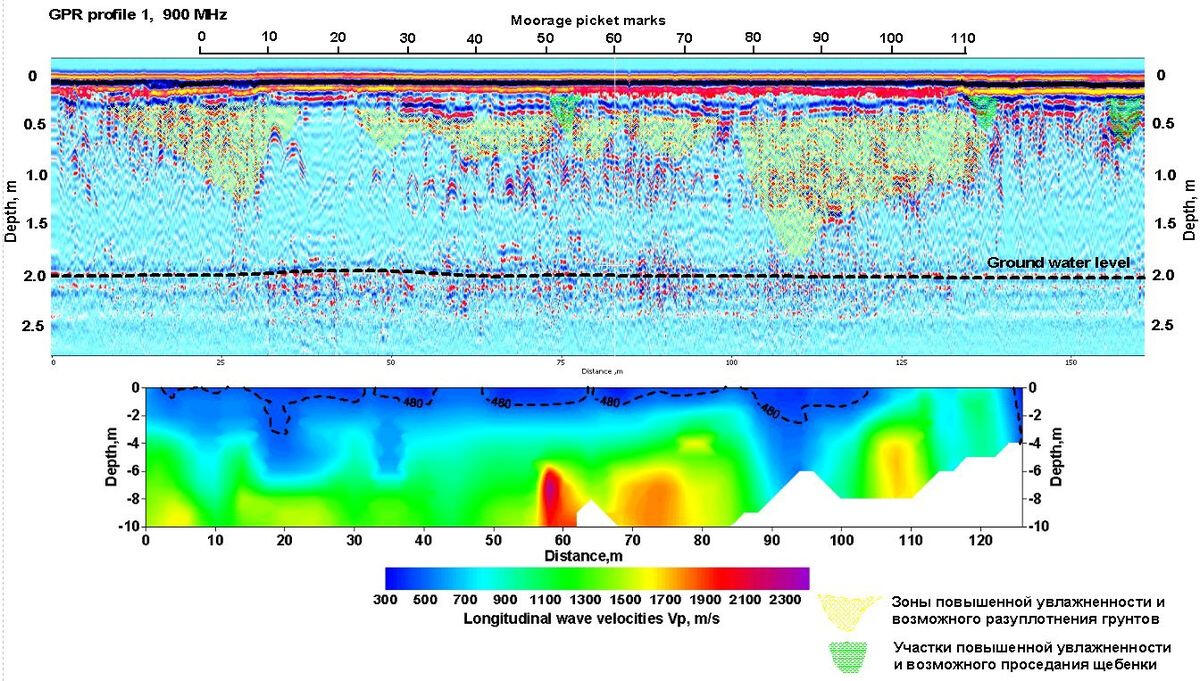
Geophone arrangement for profiling using refracted and surface wave methods
The technical task included:- seismoacoustic study of the condition of the bulk soil massif at the base of the berth of the Ventspils Free Port using a set of refracted, surface and reflected wave methods to a depth of 10-15 m.- testing of the ground penetrating radar probing method.The scope of the completed studies:- seismic profiling using the refracted, surface and reflected wave method along one 126 m long profile;- radar probing of subsurface layers using two types of receiving and emitting antennas with an operating frequency of the emitted pulse of 150 MHz and 900 MHz along four 160 m long profiles;When profiling using the refracted wave method, the pitch of the receiving channels was 2 m, the pitch of the excitation points was 8 m, the excitation points were processed with the excitation point offset by 16 m from the initial and final points of the geophone arrangement.
Detection of the removal of pier foundation soils using seismic profiling and ground penetrating radar
The most informative parameter characterizing low-density zones should be considered the propagation velocity of transverse waves. According to this parameter and the closely related calculation of the angle of internal friction in the surface layer of dry bulk soil, 4 anomalous zones extending to a depth of 2-4 m are quite clearly distinguished. The value of this parameter is not affected by soil water saturation, so it can describe the properties of the soil massif both above the water level and in the waterlogged part of the soil interval.According to the shear wave velocity parameter above a depth of 8 m in the interval PK 30-PK-40, a wide anomaly of reduced velocities is distinguished, which is probably associated with the washing out of the fine fraction of accumulated sand and its removal into the river. This anomaly deserves special attention, since it is located near the area of the eliminated pier collapse.
GPR section with a 900 MHz antenna and a section of longitudinal wave velocities
The deflection of reflecting horizons in the roof of the ground massif can be associated with the settling of the rubble layer and the flooding of the sand, which causes a "delay" in the time of recording the reflection from the underlying horizons.Radar profiles with limited penetration of the probing pulse into the soil below the groundwater level mainly characterize the drained soil layer up to 2 m deep from the probing surface. These areas mainly reflect the flooding of the sand layer, which can be short-term.
Choklon-2 flotation waste settling tank (Peru)
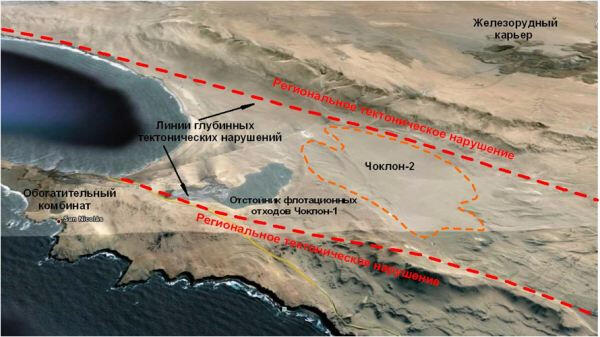
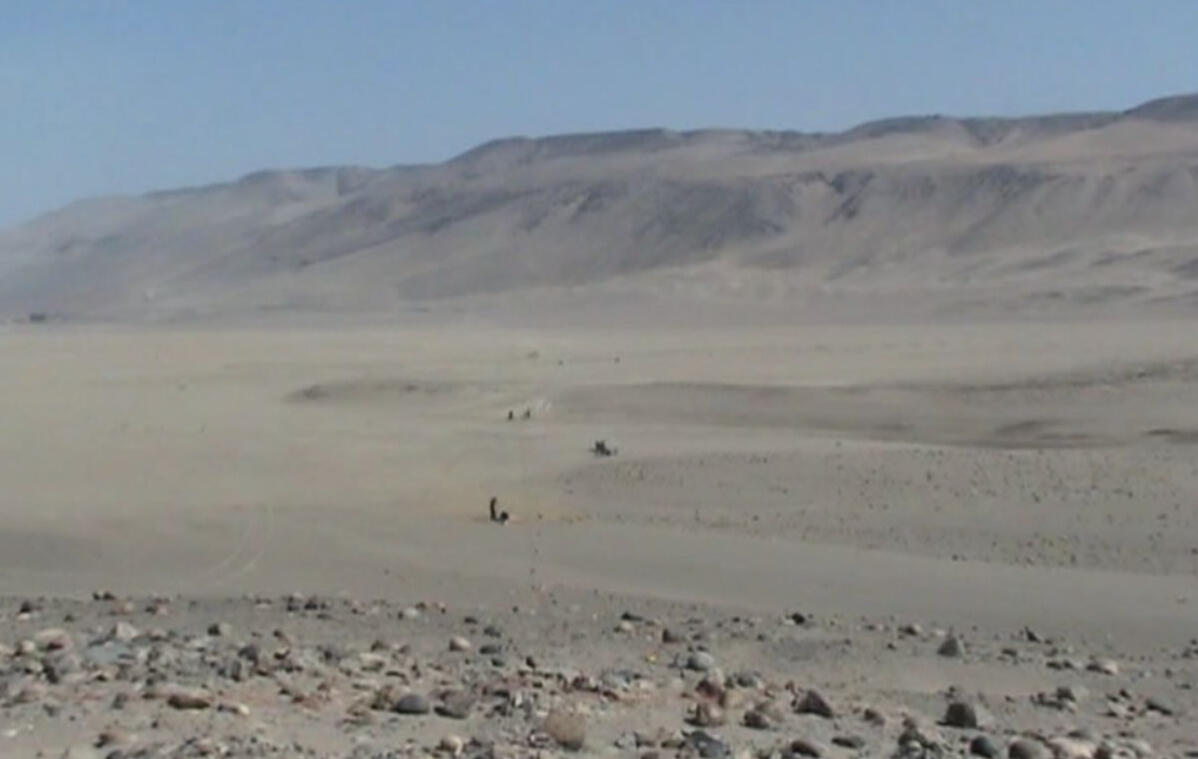
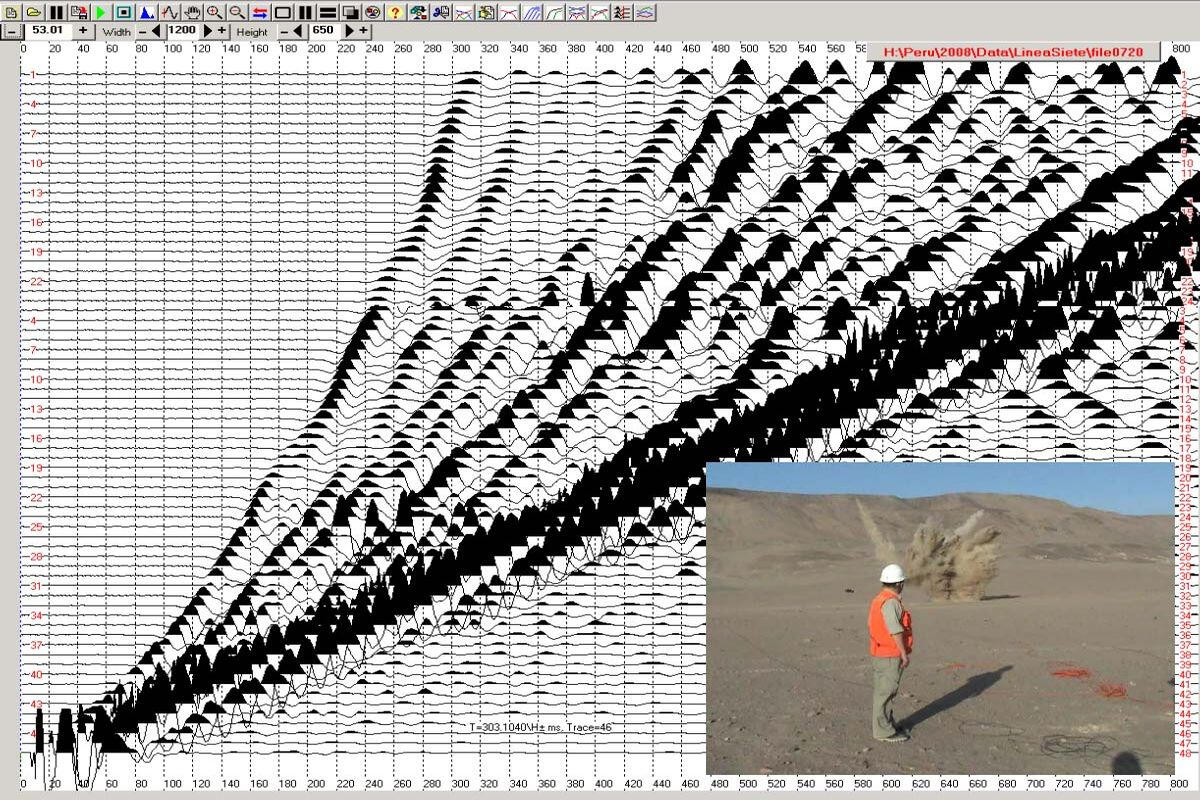
Flotation waste settling tank of the Choclon-II iron ore plant of Show Gang (Peru)
The objective of the work was to identify possible tectonic faults in the Quaternary soil massif at a depth of up to 50 m, through which toxic waste from the flotation enrichment of ore could end up in the ocean.
.
Seismic profile in the intermountain valley - at the site of the designed flotation waste settling tank
The work was carried out along a sparse orthogonal network of profiles located at intervals of 500-700 m from each other. The orientation of the profiles is along and across the intermountain valley, in the lowest point of which the section of the designed settling tank is located. The methodology of the work is focused mainly on recording refracted waves excited by explosions of ammonite charges in pits 0.6-0.8 m deep at intervals of 120 m along the profile.
Seismogram of refracted and surface waves obtained by detonating a 3 kgf ammonite charge with a geophone array length of 360 m
The geophones are installed on a thick layer of loose sand, representing a medium with strong attenuation of elastic wave energy. Records from 800 to 1600 ms long, obtained with a discreteness of 400 and 800 μs with a step of receiving channels of 5 m, were used to construct sections of longitudinal and transverse wave velocities.
Preparation of ammonite charges
Due to the characteristics of surface soils (a thick surface layer of loose soils - dry shell sands), in which the energy of elastic waves quickly weakens, to obtain a refracted wave hodograph in the case of a first arrival with a receiving base of 250-400 m, sufficiently powerful sources of elastic waves were used - explosions of ammonite charges (with permission from environmental protection authorities).
Mountain dam on the Inambari River (Peru)
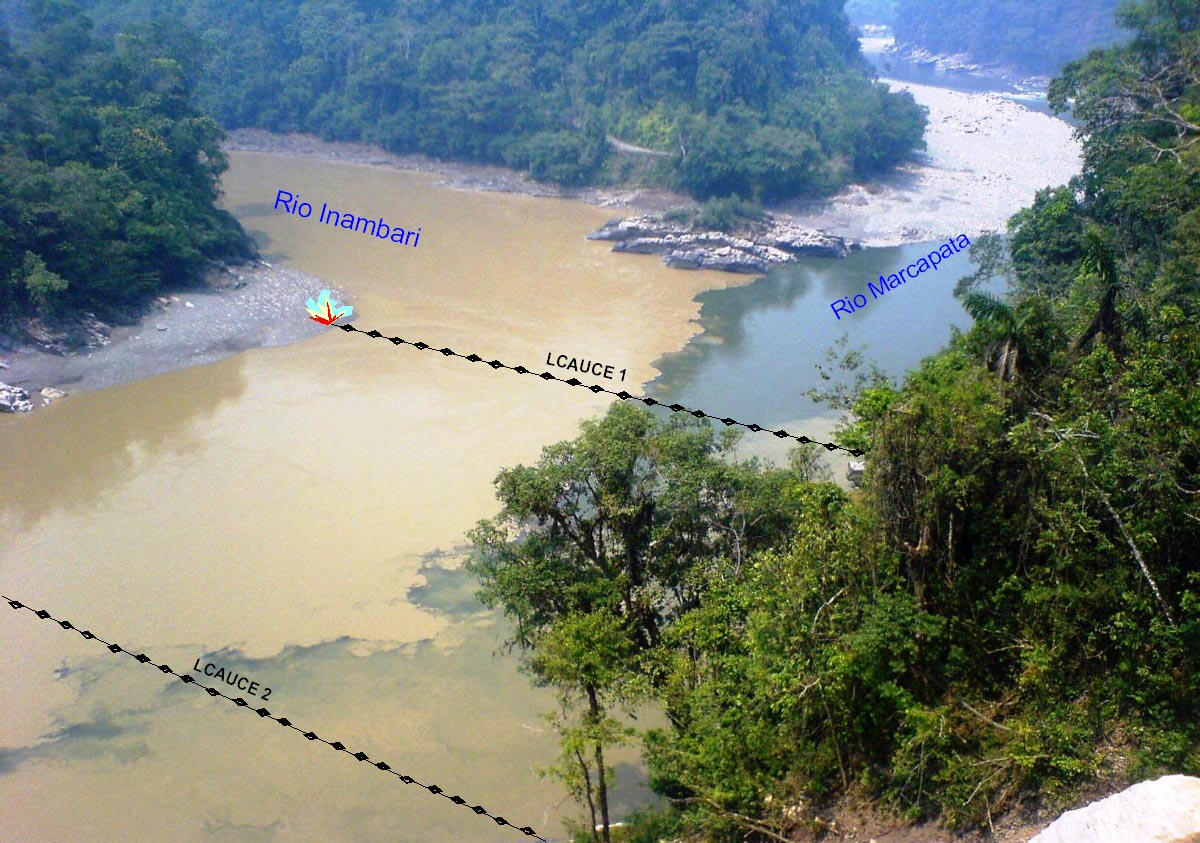
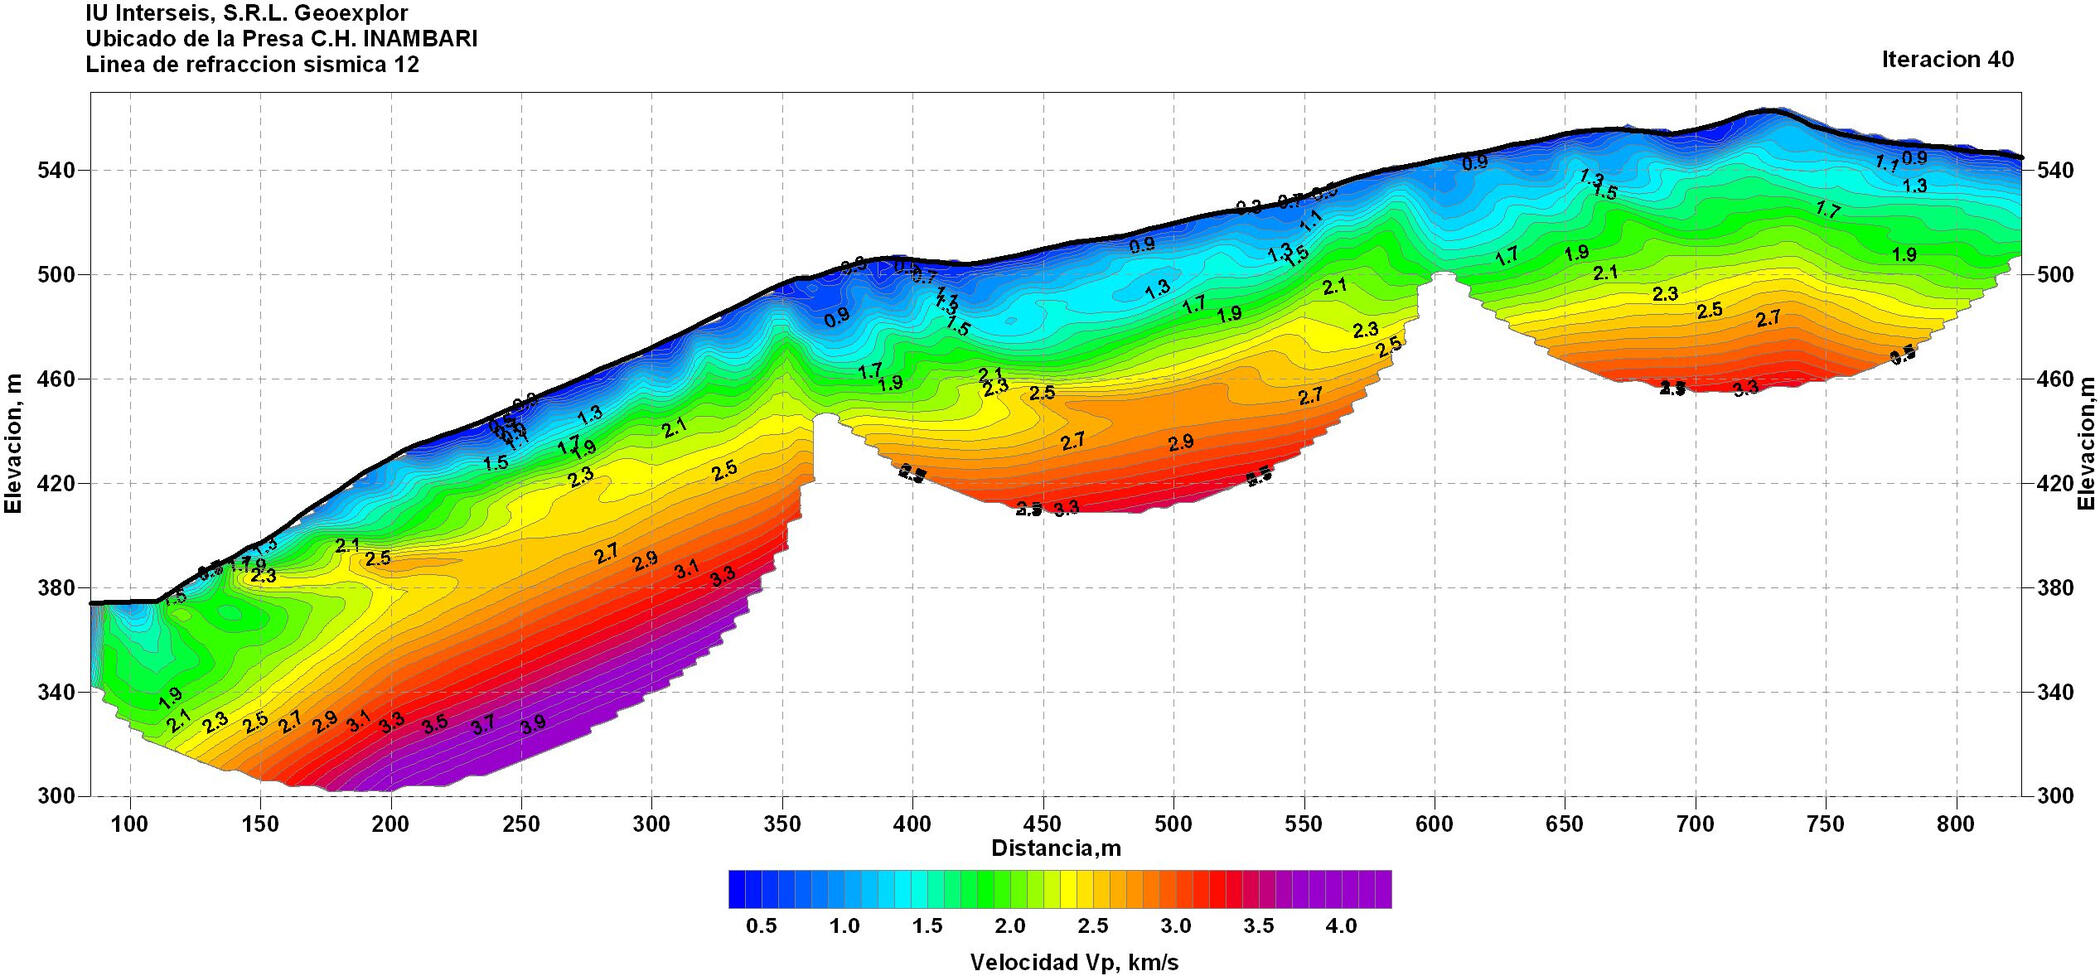
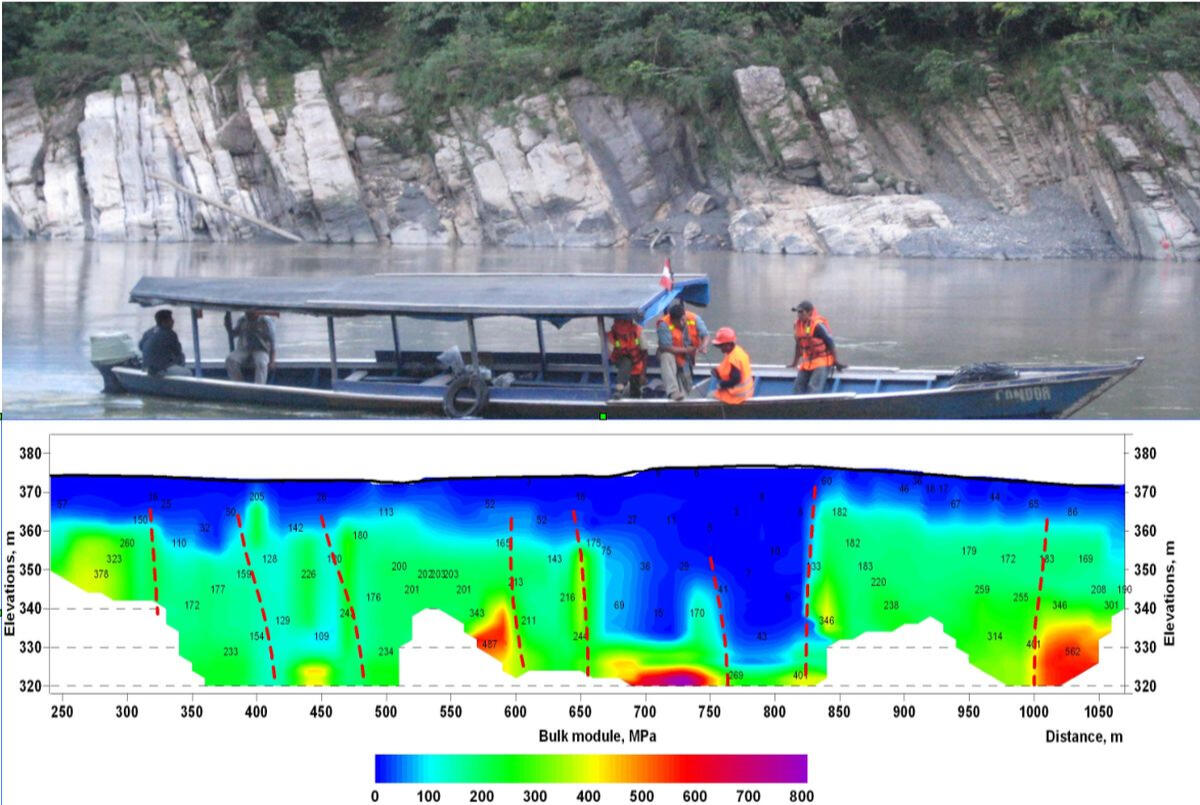
Works using the method of refracted and reflected waves in the Inambari River valley (Puno Department, Peru)
The work included profiling using the method of refracted waves on the sides of the mountain valley, along the edges of the banks and across the river bed, as well as processing the CDP profile using the method of reflected waves along the road on the right bank across the dam site.
Seismic river profiles along the design sites of the hydroelectric power station dam
For recording elastic waves on land sections, 48-channel geophone arrays with a channel step of 5 m were used. In the river bed, signals were received using floating or bottom-laid hydrophone streamers with piezoelectric pressure sensors. To excite the vibrations, explosions of dynamite charges weighing 200-600 g were used.
.
Result of processing the first arrivals of refracted waves
Section of the longitudinal waves velocities propagation along the transverse profile along the right-bank part of the designed dam alignment
Rock outcrops and section of the modulus of all-round compression according to seismic data through the design dam alignment
Below the design dam alignment, a wide zone of weathered native argillites with weakened strength properties appears on the section.
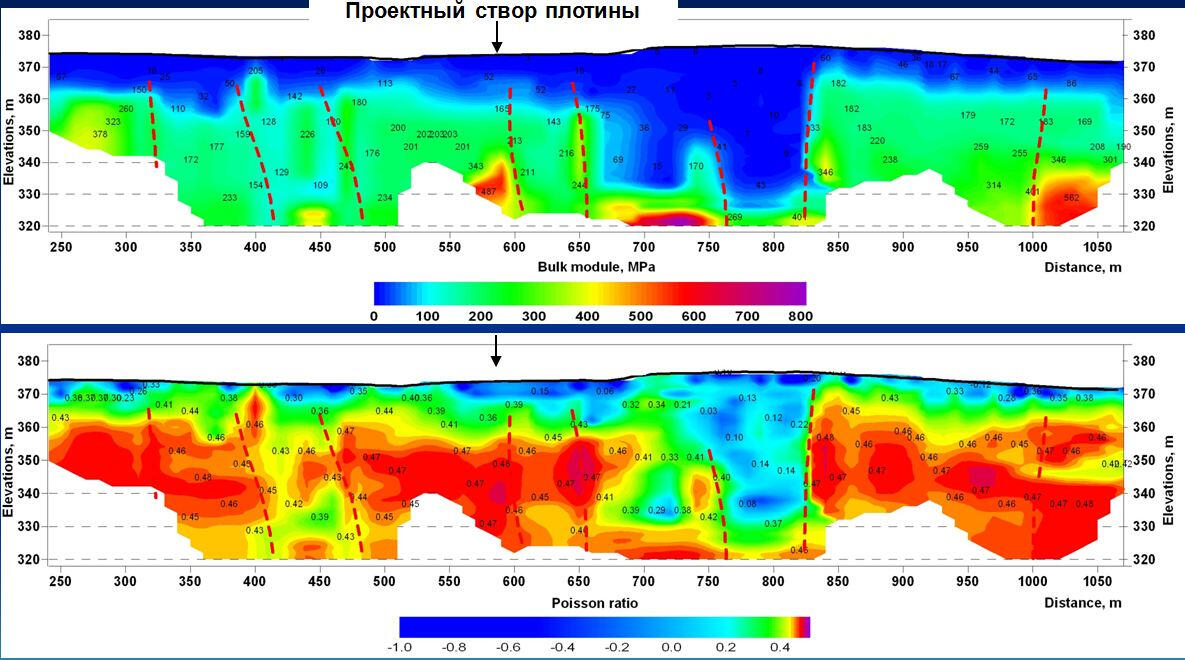
Soil failures within the BKRU-2 mine field (Berezniki, Russia)
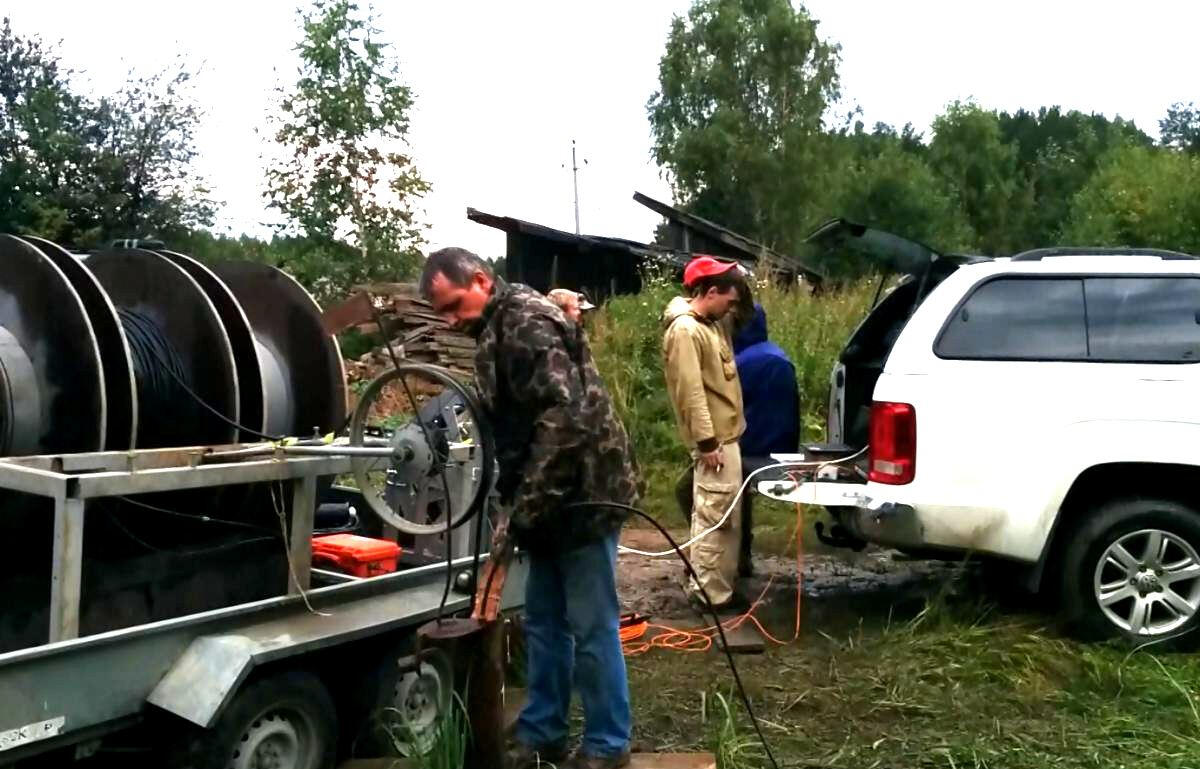
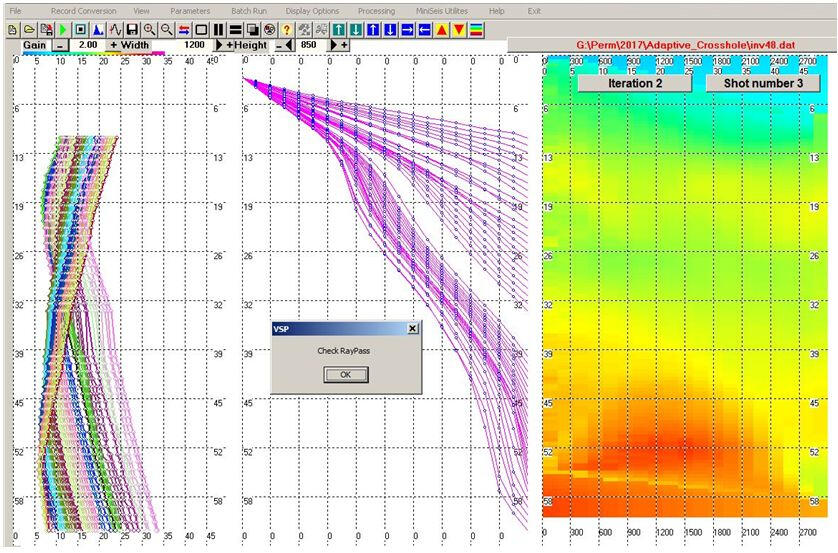
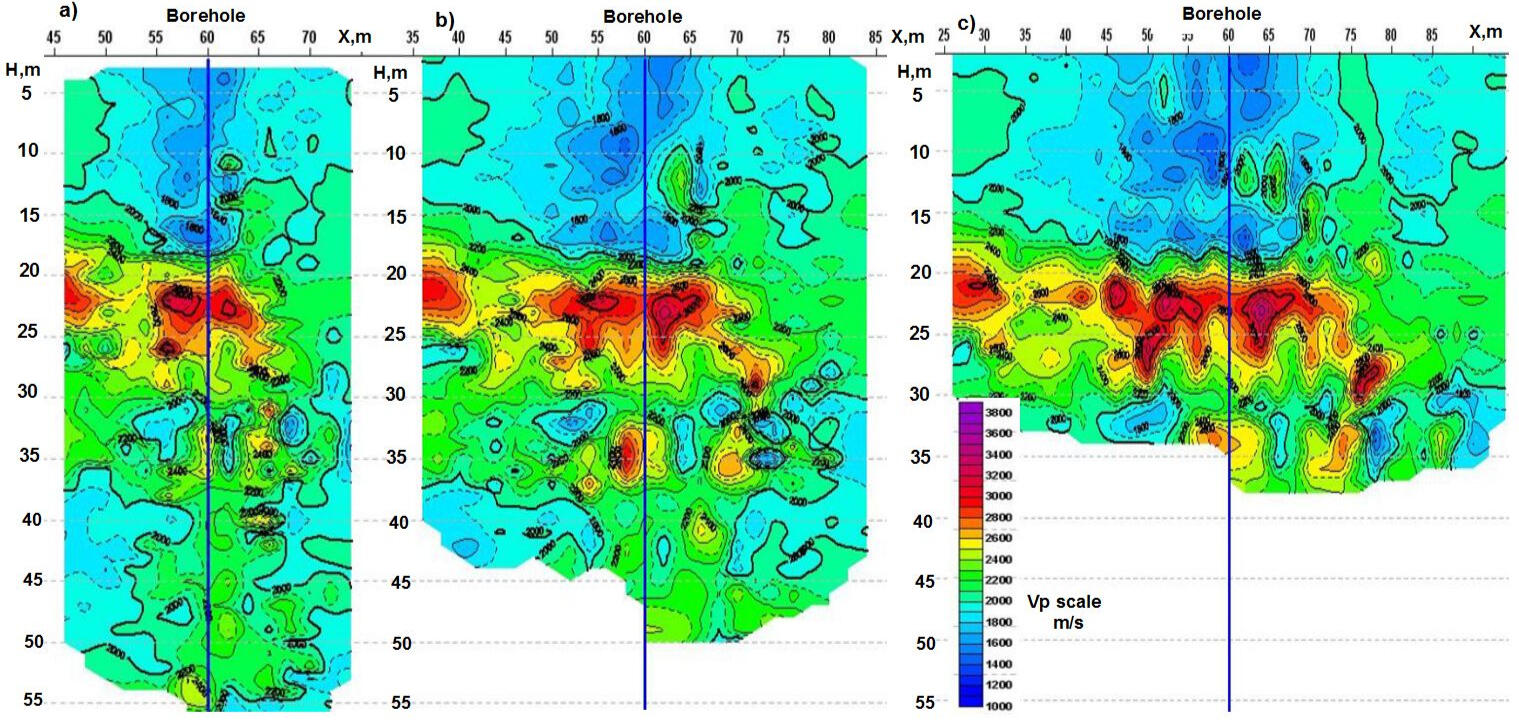
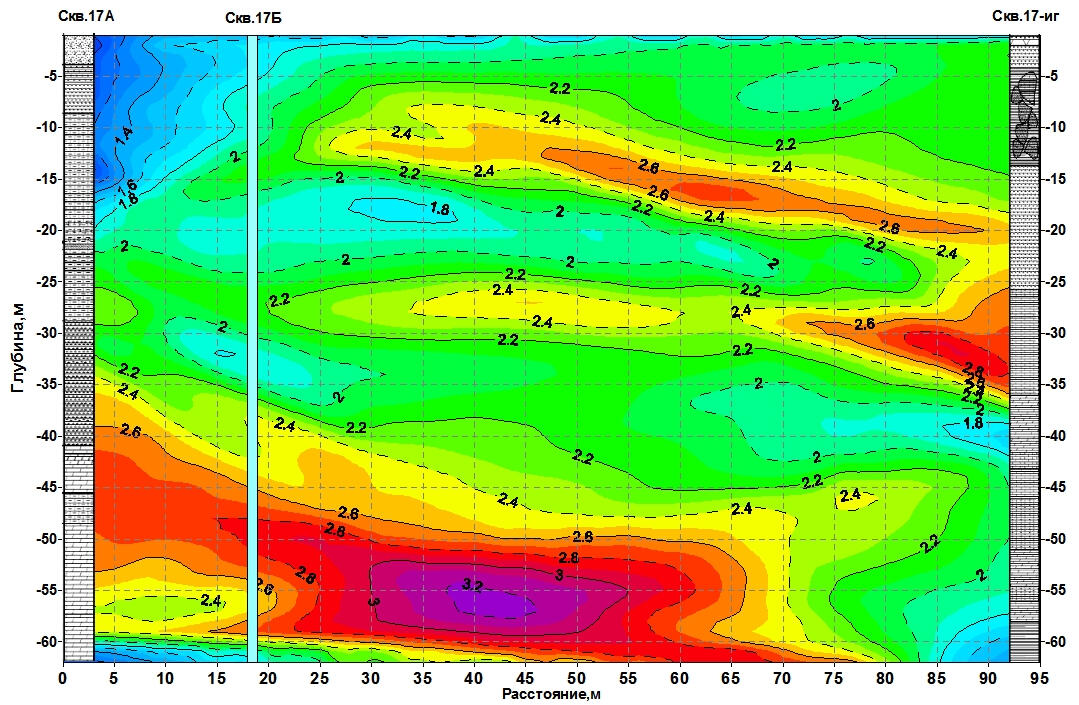
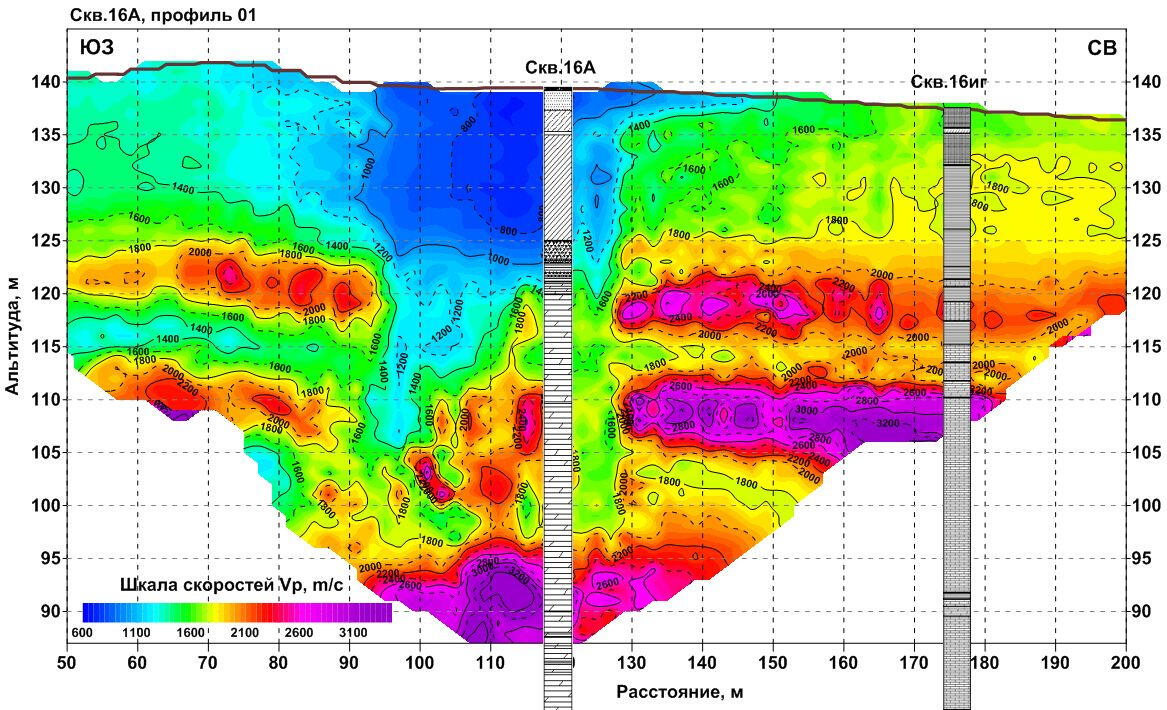
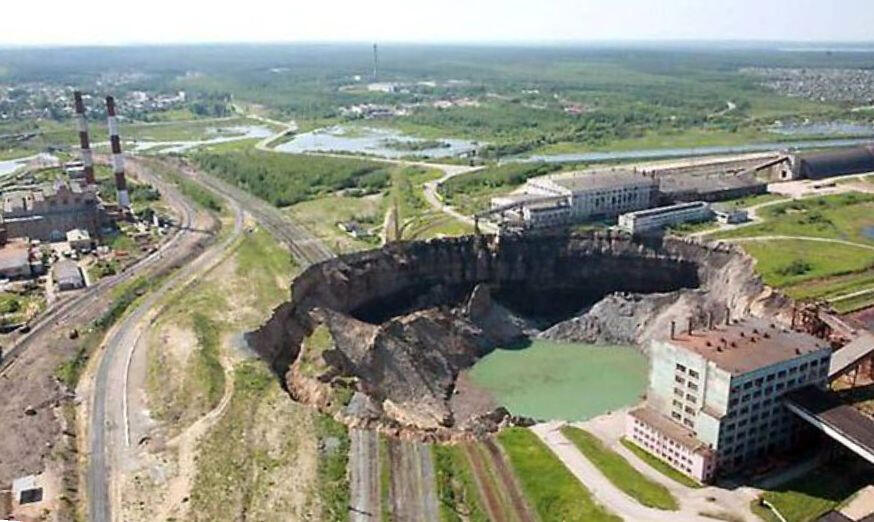
Methodological support of works by methods of non-longitudinal VSP and cross-well scanning
The works were carried out on the territory of the largest in Europe Verkhne-Kamskoye deposit of potassium-magnesium salts. The deposit has been developed since the 30s of the last century. Mine fields cover vast areas of urban and industrial development, in the soil foundations of which dangerous man-made processes have recently begun to develop under the influence of underground workings. The Mining Institute of the Academy of Sciences of Russia has been identifying and monitoring such processes for several decades. One of the most promising monitoring methods is seismic research on the surface and in internal points of the environment.Our task was methodological support of geophysical works by methods of vertical seismic profiling and cross-well seismoacoustic scanning, development of software for data processing and interpretation.
Software for data processing and interpretation
The development of unique data processing programs was carried out in parallel with the development of field work methods using the non-longitudinal VSP and cross-well seismic scanning methods. Almost every new research object, due to significant differences in seismogeological conditions, area and depth of research, required the development of new algorithms and the structure of processing modules.The core of the algorithm was the module for adaptive modeling of a heterogeneous-layered velocity medium by minimizing the functional of the travel time of an elastic wave from a source to a receiver. An example of constructing a velocity model of a medium based on the cross-well scanning method using the principle of minimal deviations of a series of theoretical hodographs from the observed ones is shown in the figure on the left.
Identification of zones with weakened strength properties in areas of soil mass subsidence using the non-longitudinal VSP method
Failures of the suprasalt layer occurred in many areas of residential and industrial development in Berezniki. Subsidence of the soil mass above the mine workings is observed in an even greater number of areas. The subsidence rate can reach up to 40 cm per year in some places. Monitoring wells have been drilled in many of the identified subsidence areas, in which periodic studies are carried out using borehole seismic exploration methods together with ground profile observations. Observations using the non-longitudinal VSP method are carried out along a network of arbitrarily located profiles (depending on the characteristics of the relief and obstacles). With direct VSP, the sources of excitation of elastic waves are located on the surface, and the signal receivers are in the borehole. With inverse VSP, the opposite arrangement takes place.The figure on the left shows the result of elastic wave velocities measurements along three parallel profiles located at a distance of 10, 12, and 14 m from the borehole with receivers. In the observation area, the subsidence rate of the earth's surface is 11 cm per year. The area of the most intense subsidence is displayed on the profiles by sharply reduced elastic wave propagation velocities near the monitoring well.
Crosshole seismoacoustic method
Three years later, two more observation wells were drilled in this area, in which studies were carried out using the seismoacoustic transillumination method. The measurements were carried out with the excitation of pulses by an electric spark source and the reception of signals by hydrophones in the forward and reverse directions between three wells 60 m deep, located on the same line. Good convergence of the transillumination results in the forward and reverse directions confirms the general decrease in the elastic wave propagation velocities in the area of well 17ig (in the right part of the section). The decrease in velocities is most clearly noted in the lower part of the section at a depth of more than 35 m.In the left part of the section near well 17A, a zone of low velocities is recorded in the near-surface part of the rock massif, which may indicate the formation of a new area of subsidence of the earth's surface.
Localization of an area of intense subsidence of the earth's surface
Research in an area with a high rate of subsidence of the earth's surface (up to 40 cm per year) using non-longitudinal VSP and inter-well scanning methods revealed a local zone of a sharp decrease in elastic wave velocities with a width of about 40-50 m. The zone of destruction of the rock mass extends to a depth of 40-45 m from the surface. This example clearly shows the advantages of geophysical methods of observation at internal points of the environment, revealing spatial changes in the physical and mechanical properties of the rock mass compared to drilling wells at individual points.
Failure of the rock mass in an industrial development above a mine working
Geophysical monitoring of areas of intense subsidence of the earth's surface allows for the timely identification of locations of possible catastrophic failures within residential and industrial development and, if possible, provision for preventive measures to eliminate dangerous consequences.
Man-made failure of the suprasalt layer in the mine field of SKRU-2 ( Solikamsk, Russia)
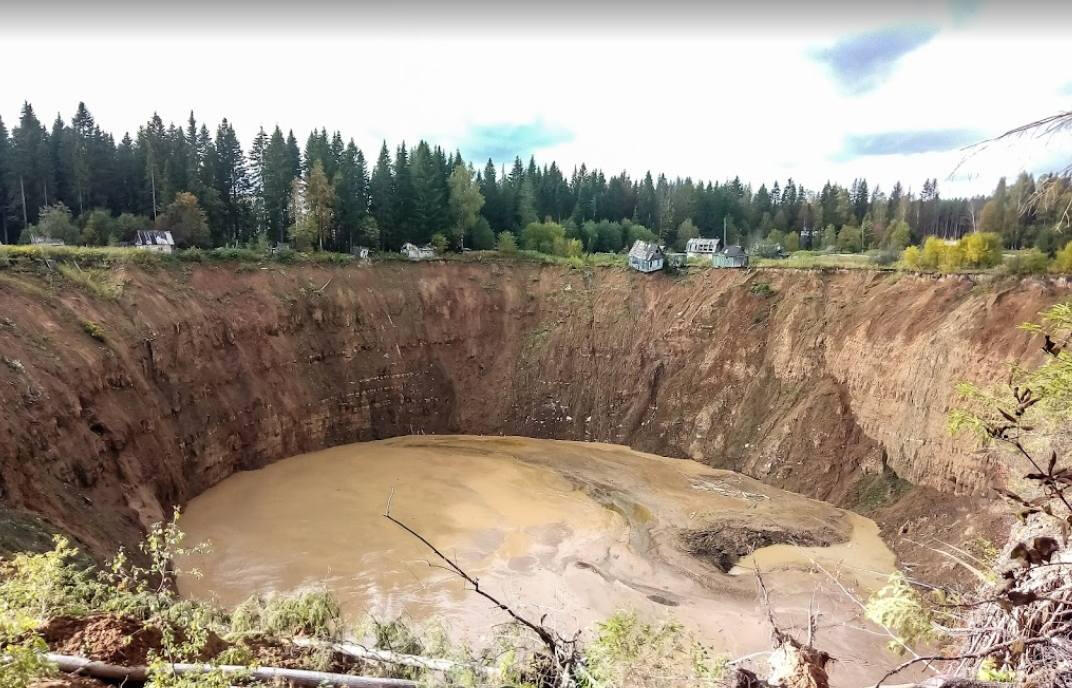
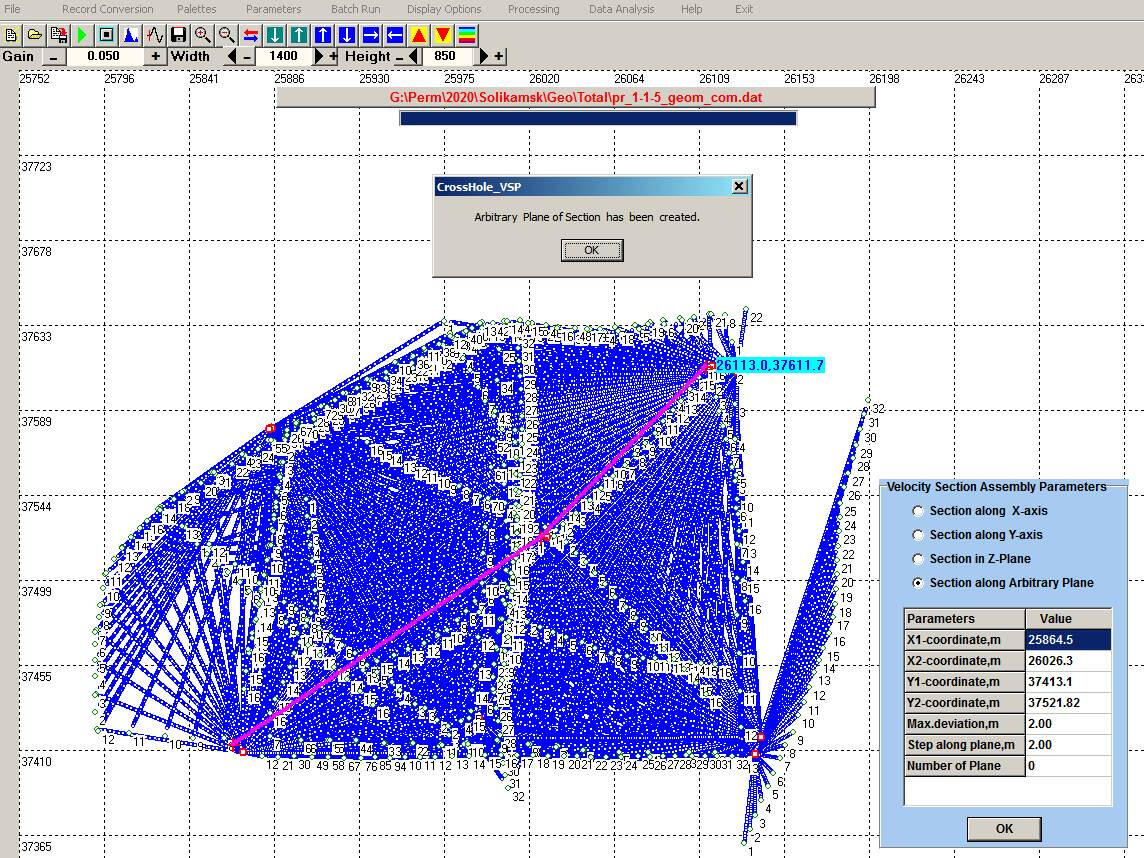
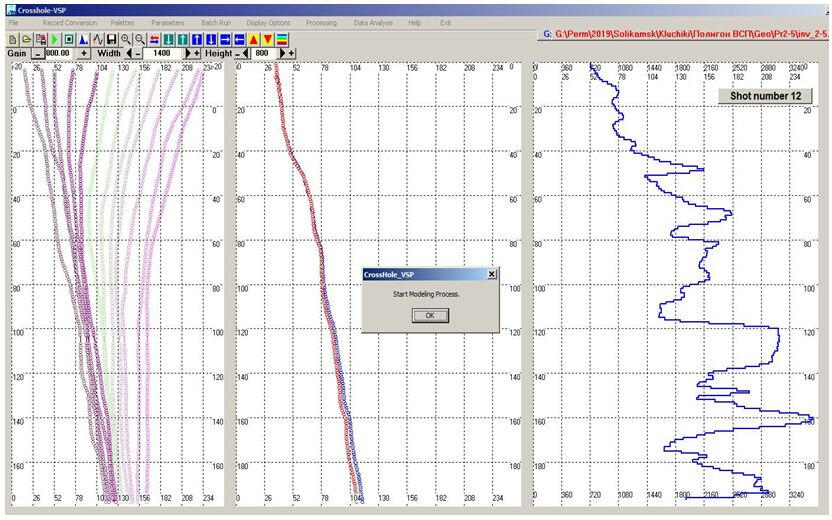
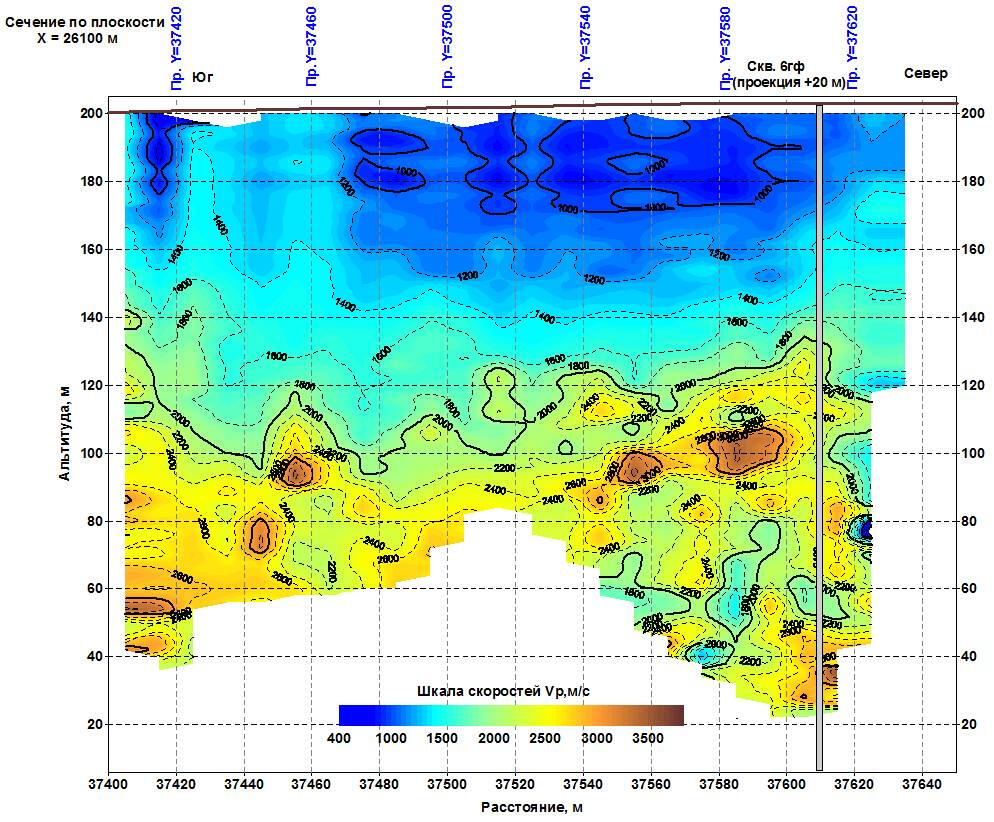
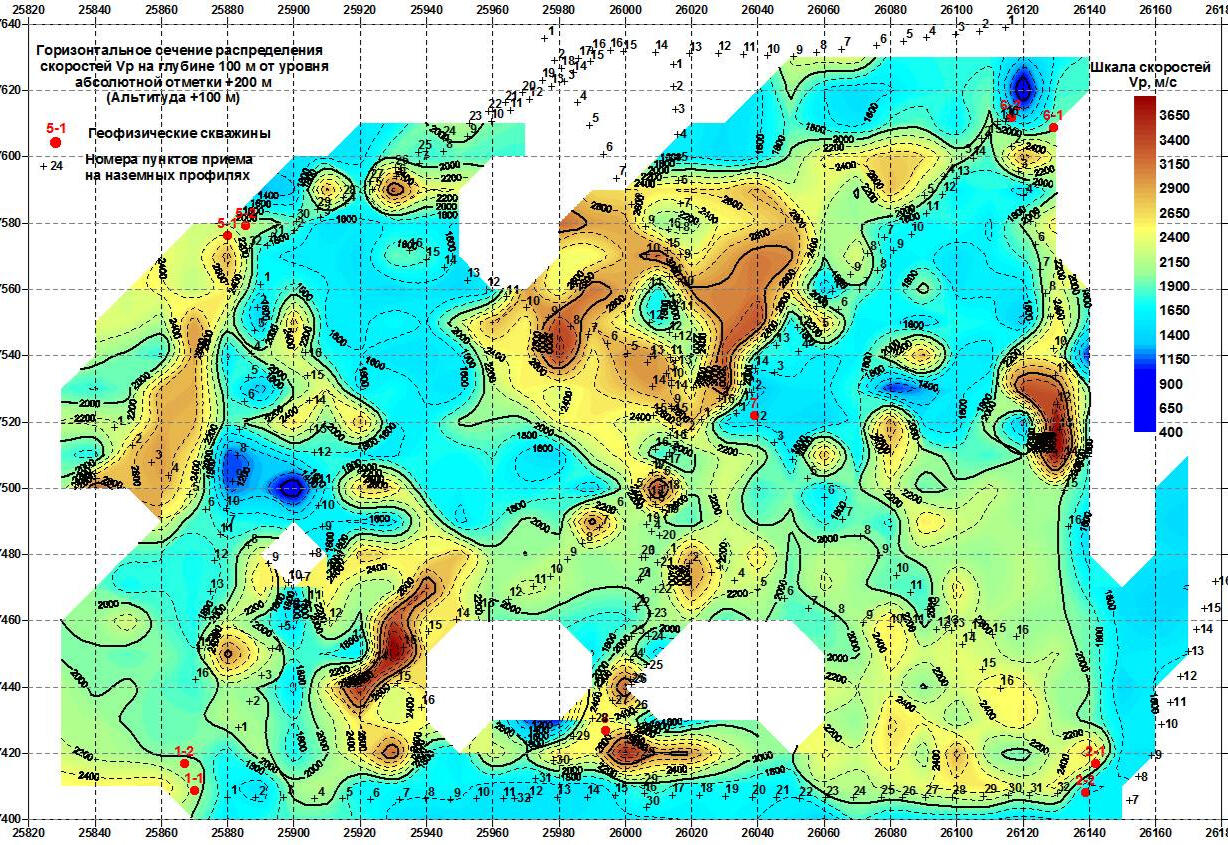
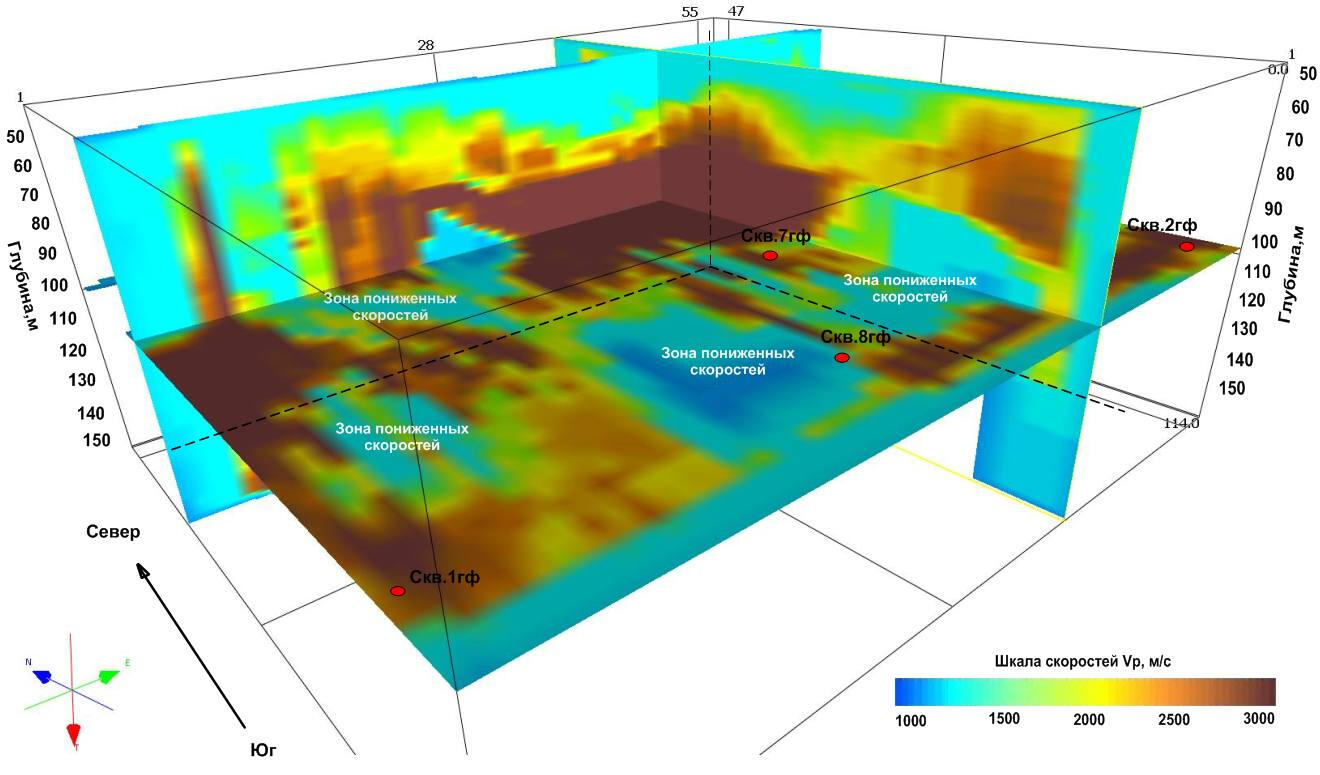
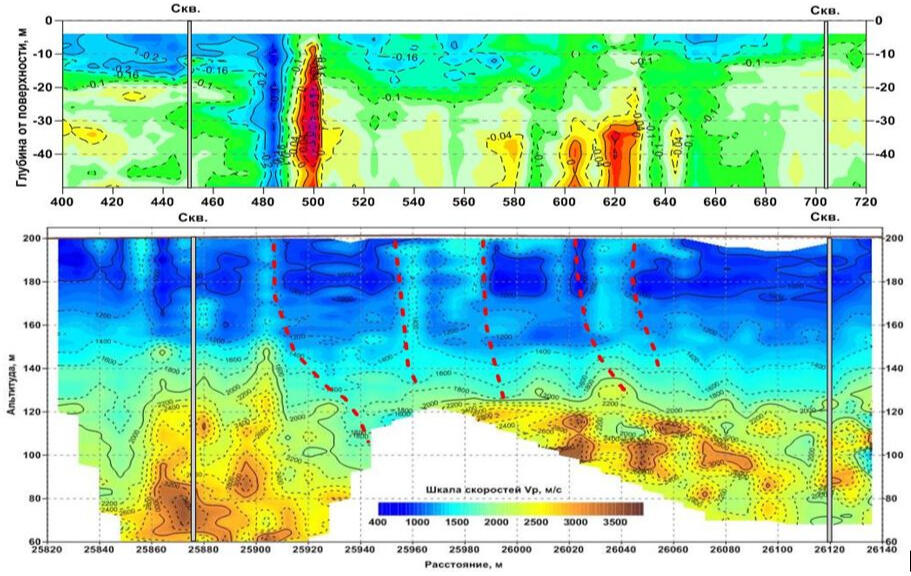
Man-made failure of the suprasalt layer in the mine field of SKRU-2
A large failure of the suprasalt layer in the mine field of the Solikamsk-2 mine administration occurred on November 18, 2014, on the territory of the Klyuchiki dacha cooperative, 3.5 km east of Solikamsk. The primary cause of the failure is considered to be the man-made earthquake that occurred in 1995 with the epicenter in the same area, the penetration of groundwater into the most highly dissolution-prone layers of carnallite and the formation of voids. The failure quickly expanded from the initial dimensions of 20x30 m to 120x125 m with a depth of 50 m in September 2015.Despite the multifaceted liquidation measures, by the time the emergency work was completed, the dimensions of the main failure were 170x190 m, and taking into account the new failure that formed in 2018 to the northeast of it, the total dimensions of the collapse zone reached 170x230 m.
Scheme of projections on the earth's surface of ray trajectories during areal vertical seismoacoustic profiling in boreholes of the geophysical testing ground
In order to organize geophysical monitoring of the state of the soil and rock massif in the mine field zone adjacent to the failure, the Mining Institute of the Ural Branch of the Russian Academy of Sciences began multifaceted geophysical work almost immediately after the failure was formed. A network of seismic sensors was installed on the surface for round-the-clock monitoring of microearthquakes. For observations at internal points of the environment, a testing ground was organized, including 6 geophysical wells 200 m deep, i.e. practically to the surface of the salt layer. A complex of seismoacoustic vertical profiling and interwell scanning was periodically carried out in the wells. In parallel, engineering seismic exploration profiles were processed on the surface around the failure.Our task was to methodically support the monitoring using observations at internal points of the environment (in geophysical wells), develop algorithms and programs for processing observations, and assess changes in the state of the soil and rock massif of the supra-salt layer. Examples of processing and interpretation of geophysical monitoring data are given below.
Calculation of a detailed velocity section based on non-longitudinal (areal) vertical seismoacoustic profiling data
In one of the options, non-longitudinal vertical profiling was performed with receivers located in a borehole, and vibrations were excited along profiles on the surface using powder charges. The profiles were positioned so that the seismic ray trajectories covered, if possible, the entire volume of the rock mass in the test site.Monitoring was performed using 6 boreholes within the geophysical test site. For each scanning plane, hodographs of the first arrivals of direct waves were constructed (on the left), for each observed hodograph, a theoretical hodograph (in the center) was selected using the adaptive modeling method, corresponding to the detailed velocity model (on the right).
Vertical cross-section of the velocity cube of longitudinal waves Vp based on area VSP dataText
A spatial coordinated velocity sample was collected for each excitation point based on the set of selected velocity models. The compiled sample for all wells in the test site was a spatial set of points with velocity values similar to the velocity cube obtained when processing 3D land seismic data. Subsequent analysis of the velocity distribution in the array was performed using a series of arbitrarily oriented vertical and horizontal sections of the obtained spatial sample.A vertical cross-section of the velocity cube can be obtained using an arbitrarily oriented set of planes through the volume of the spatial sample. In this example, the projections of the planes of the sections pass along a given curvilinear profile, at the beginning and end of which monitoring wells are located.
.
Example of horizontal velocity section at absolute elevation +100 m (approximately at a depth of 100 m from the surface)
The horizontal section can be set at any absolute elevation within the volumetric velocity sample. Due to the peculiarities of the seismic ray propagation geometry with depth, the total area of horizontal displacement decreases, and the section fragments are “pulled” toward the monitoring well points.
.
Construction of the velocity cube Vp based on non-longitudinal vertical seismoacoustic profiling data
For interactive interpretation, the resulting volumetric velocity sample can be represented by a velocity cube. Three orthogonal section planes can be interactively moved for a more visual representation of the spatial distribution of velocity anomalies.
Joint interpretation of borehole observations and surface seismic exploration using the surface wave method
Example of localization of potentially dangerous zones of vertical fracturing in the massif of the suprasalt strata.Above is a section of the attenuation coefficient of surface waves based on ground seismic survey records; below is a section of the propagation velocities of longitudinal waves based on non-longitudinal vertical seismoacoustic profiling data in boreholes.
Nezhin mining and processing plant (Belarus)
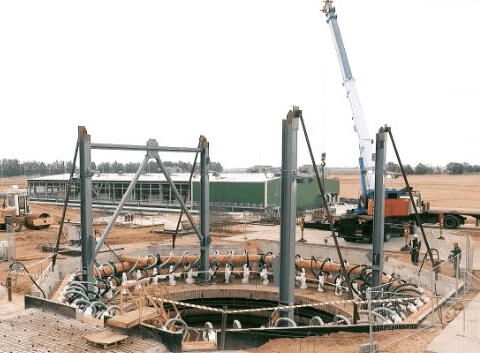
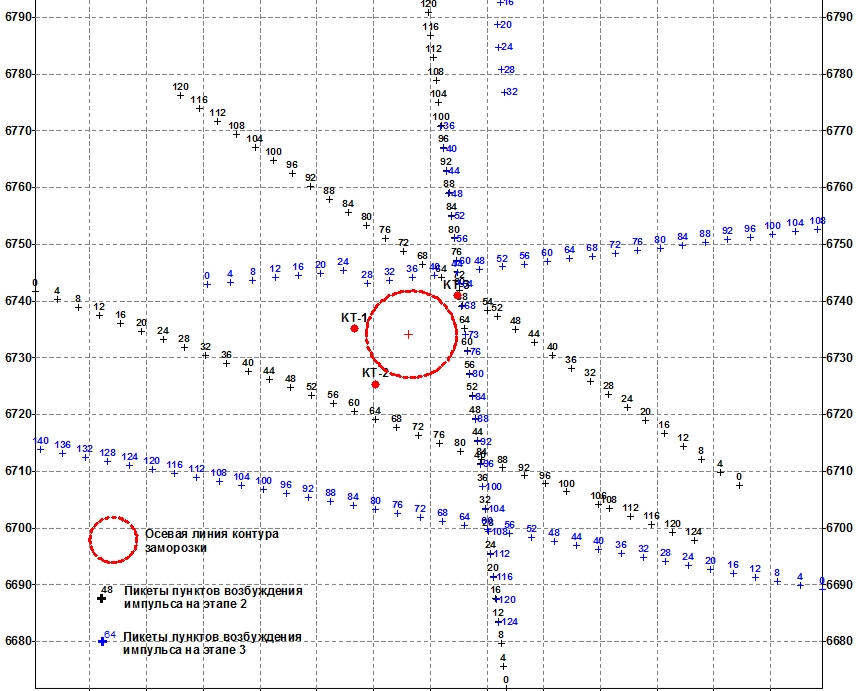
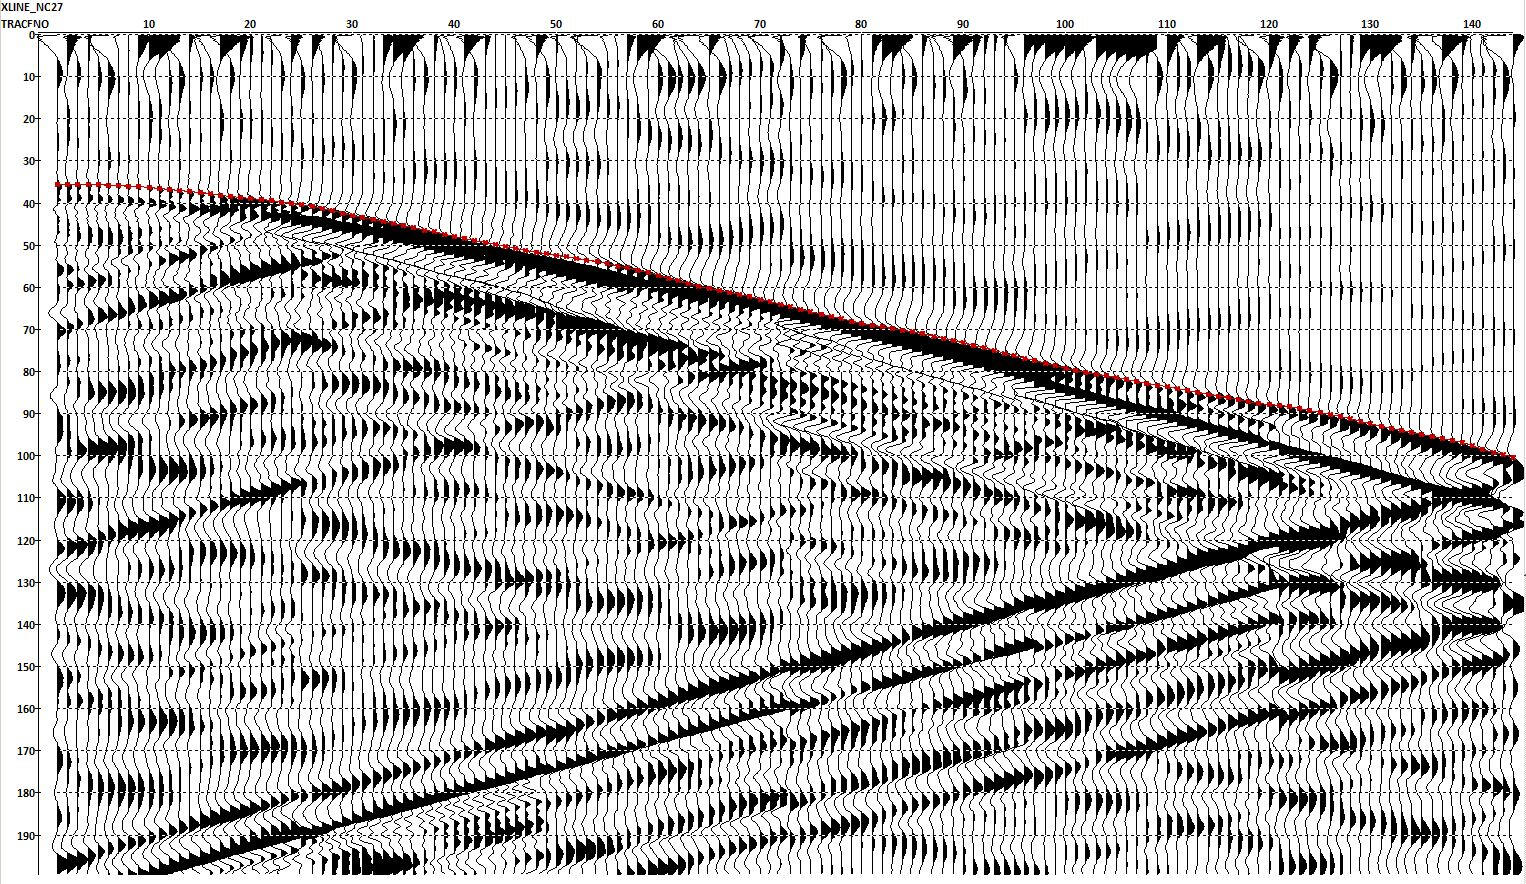
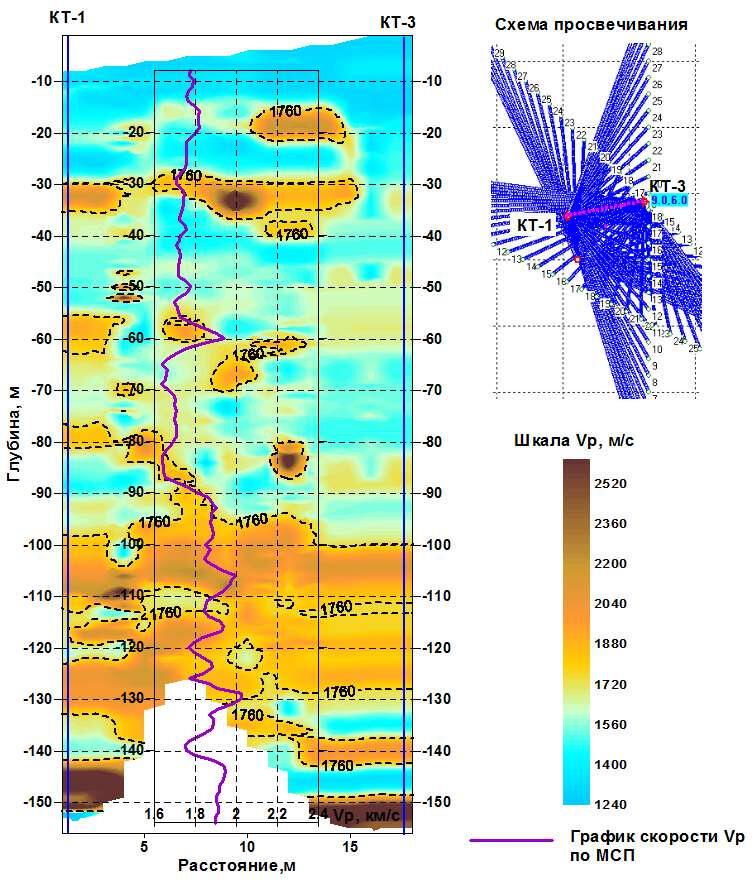
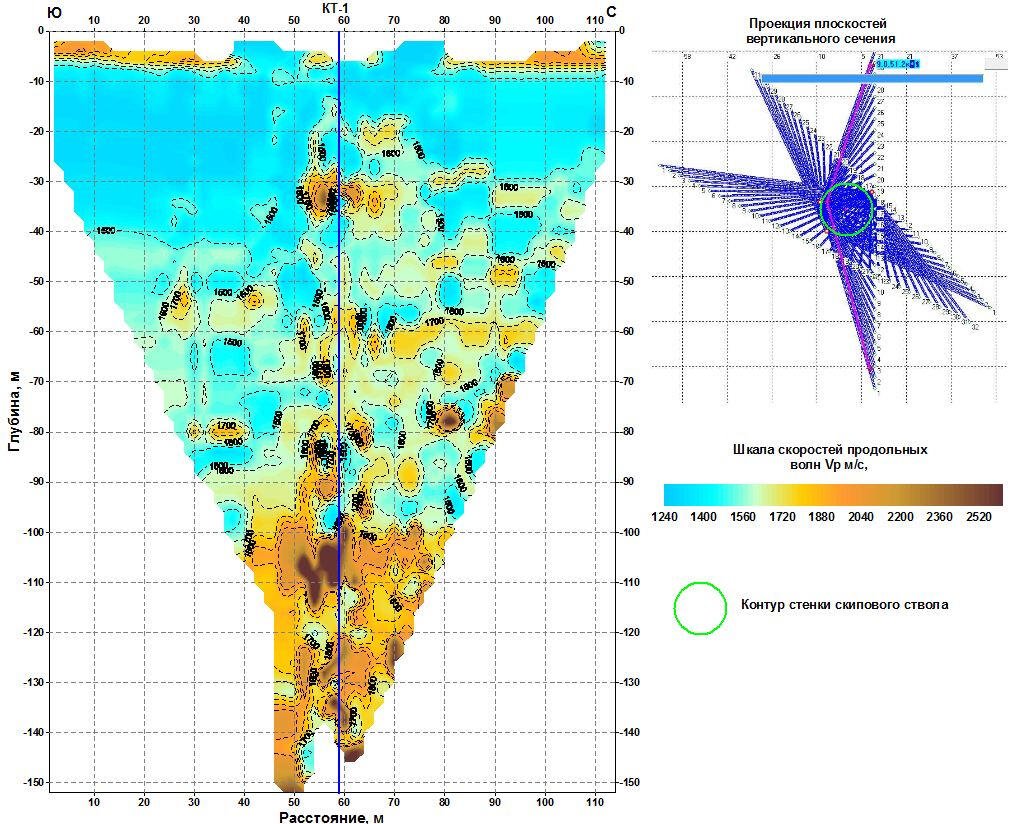
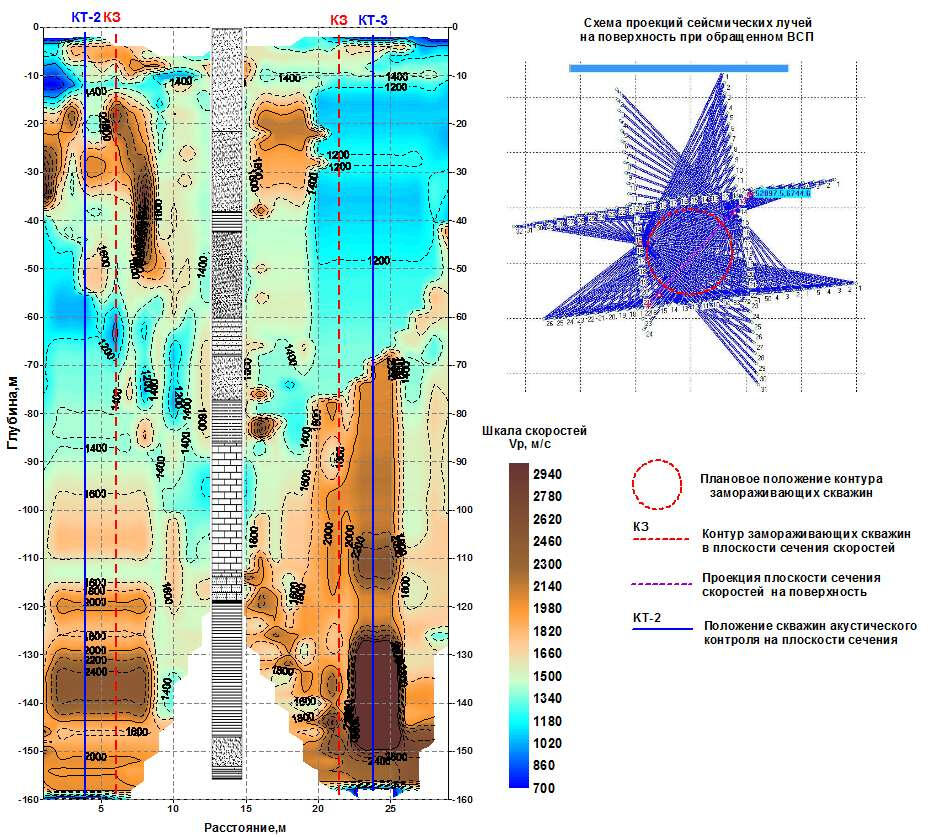
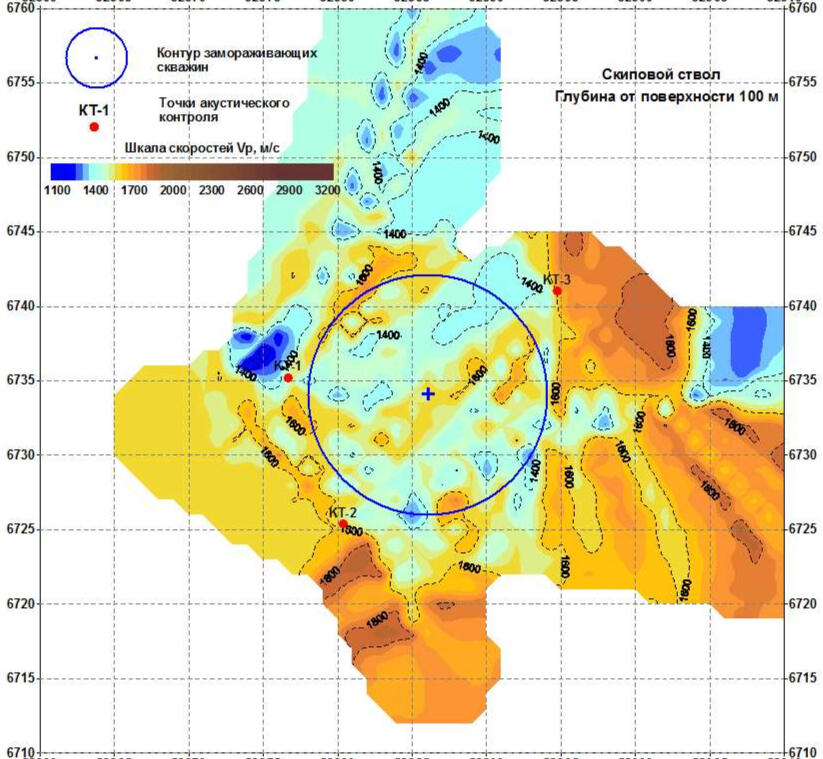
Processing and interpretation of acoustic monitoring data of rock freezing in the areas of sinking of mine shafts of the Nezhinsky Mining and Processing Plant
The purpose of the work is to monitor the temperature regime of the rock mass during the formation of an ice wall in the freezing zone of the Nezhinsky Mining and Processing Plant shafts using ultrasonic (acoustic) monitoring methods. Field measurement work was carried out by the Active Seismic Acoustics Department of the Mining Institute of the Russian Academy of Sciences.Our task was to provide methodological support, processing and interpretation of non-longitudinal vertical seismic acoustic profiling data in control boreholes.
Observation systems
Non-longitudinal vertical seismic profiling (VSP) in the area of sinking of mine shafts was carried out using the direct scanning method with the location of seismic pulse excitation sources along non-longitudinal profiles on the surface, and receiving hydrophone probes in the borehole.The layout of the source lines and control boreholes is shown in the figure on the left. The step of moving excitation points along the profiles is 4 m, the step of receiving hydrophone probes in the borehole is 1 m. Due to the appearance of new objects on the site during construction, the layout of the excitation source lines differed significantly at different stages of the research.
Analysis of the wave pattern
The figure shows a typical time section obtained at the 3rd stage of the work (after freezing of the soils along the ring contour of the ice wall). The wave pattern to a depth of 150 m is characterized by a large number of well-correlated falling and rising longitudinal waves. In the first wave arrivals, anomalous zones of increased velocities are clearly visible at intervals of depths of the most complete freezing of the soil massif.
.
Section of longitudinal wave velocities based on non-longitudinal VSP data and velocity graph based on cross-hole scanning data before freezing
The work was carried out in three stages: before freezing, in the middle stage of freezing and after freezing of the ice-rock wall after the start of sinking the shafts. Freezing was carried out by pumping low-temperature nitrogen through freezing boreholes located in a ring along the contour of the walls of the shaft. Acoustic measurements were carried out in three control boreholes located 2-3 m beyond the outer contour of the freezing boreholes.Observations were carried out using the non-longitudinal VSP method along profiles located beyond the contour of the freezing boreholes and the cross-hole scanning method between each control borehole through the rock mass of the design shaft.
.
.
Section of longitudinal wave velocities according to non-longitudinal VSP data before freezing
The upper part of the section is characterized by relatively low (1200-1500 m/s) velocity values corresponding to the aeration zone and water-saturated sandy-clayey soils. Small lens-shaped inclusions of denser lithological differences are noted. Starting from a depth of 95-100 m, a sharp increase in velocities is noted, corresponding to dense carbonate-terrigenous rocks.
.
Section of longitudinal wave velocities according to non-longitudinal VSP data during freezing
At the second stage of research, vertical zones of increased velocities appear in the upper part of the section near the contour of freezing wells during freezing. A distinct manifestation of freezing is also noted in the deep part of the wellbore, in the interval of bedrock occurrence. In the middle part at depths of 55-80 m, a zone of low velocities remains, which is presumably associated with an insufficient degree of freezing due to the manifestation of active hydrodynamic processes in the soils.
.
Horizontal section of longitudinal wave velocities according to non-longitudinal VSP data during freezing at a depth of 100 m from the surface.
Horizontal sections of the obtained volume sample of velocities at different depths allowed us to characterize the distribution of velocities and relate them to the features of the lithology and hydrodynamic regime of the rock mass. Accordingly, this allowed us to assess the degree and quality of freezing of the ice wall in different intervals of the shaft.
Clients and Contractors
1997 Mining Institute Ural branch of RAS (Perm) Development and production of a set of engineering 48-channel seismic station IS-48 and 96-channel switchboard channels for work in underground salt mines and in the mine fields Upper Kama potash deposit
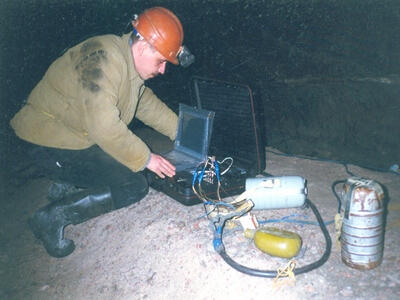
1997 г. Горный Институт УрО РАН (г.Пермь) Разработка и изготовление комплекта инженерной 48-канальной сейсмостанции IS-48 и 96-ти канального коммутатора каналов для работ в подземных выработках и на шахтных полях Верхнекамского месторождения калийных солей
1998 Mining Institute Ural branch of RAS (Perm) Development and production of a set of mine 32-channel geoacoustic locator IS-32.01 and software for data collection and processing
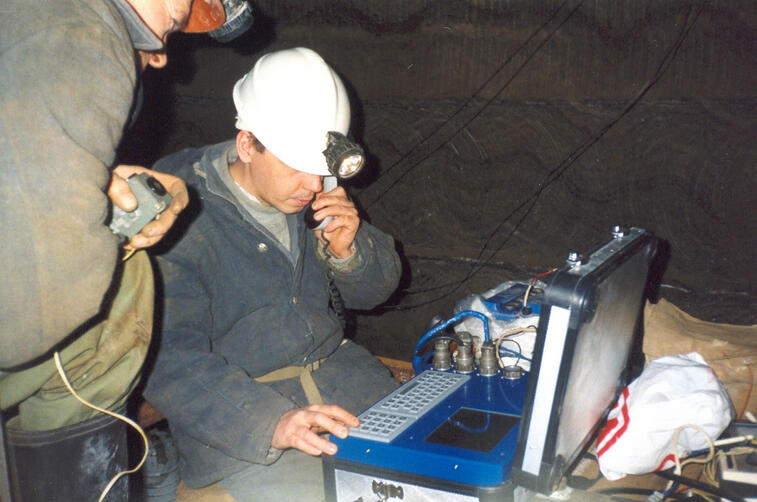
1998 г. Горный Институт УрО РАН (г.Пермь) Разработка и изготовление комплекта шахтного 32-х канального геоакустического локатора IS-32.01 и программного обеспечения сбора и обработки данных
1999 Trust "Kaliningradgeofizika" (Kaliningrad) Development and production of 2 sets of 32-channel engineering seismic stations IS-32.02 and software for data collection and processing of MSL and Refraction Seismic Technique
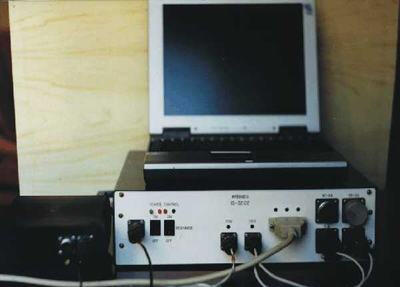
1999 г. Трест "Калининградгеофизика" (г.Калининград) Разработка и изготовление 2-х комплектов 32-х канальных инженерных сейсмостанций IS-32.02 и программного обеспечения сбора и обработки данных МСК и МПВ
2000 AS "Ceļuprojekts" (Riga) Geotechnical investigations on the construction site of a new bridge over Dubna river in Livani (Latvia)
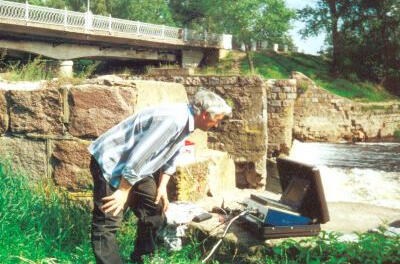
2000 г. AS "Ceļuprojekts" (г.Рига) Инженерно-геофизические исследования на участке строительства нового моста через р.Дубна в п.Ливаны (Латвия)
2000 "Rigas HES "(Riga) Experimental works by methods of engineering seismic prospecting and GPR on the site of the dam of Riga HPP
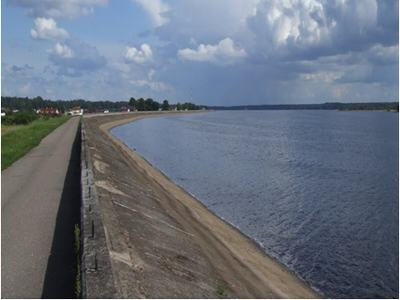
2000 г. "Rigas HES" (г.Рига) Опытные работы методами инженерной сейсморазведки и георадарного зондирования на участке дамбы Рижской ГЭС
2000 IU " L. Konstante "(Riga) Geophysical studies of the bottom of the drainage channel in the lower part of the apron of the Kegums HPP-2
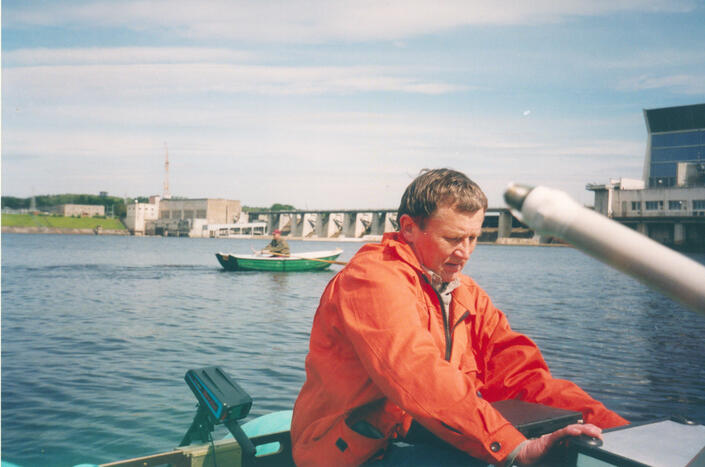
2000 г. IU "L.Konstante" (г.Рига) Геофизические исследования дна водоотводного канала в нижней части рисбермы Кегумской ГЭС-2
2001 SIA "Balt-Ost-Geo"(Riga, Latvia), Geophysical study of the bottom of dredging on the fairway of the port of Salacgriva (Latvia)
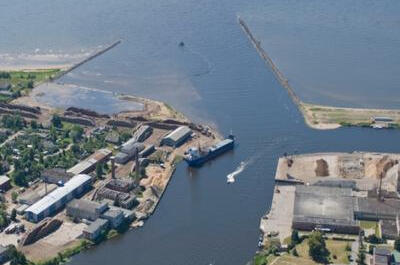
2001 г. SIA "Balt-Ost-Geo"(г.Рига) Геофизические исследования дна участка дноуглубительных работ на фарватере порта Салацгрива (Латвия)
2001 IU " L-Konstante "(Riga) Monitoring geophysical surveys on the site of repair and preventive works in the lower part of the apron of the Kegums HPP-2 drainage channel
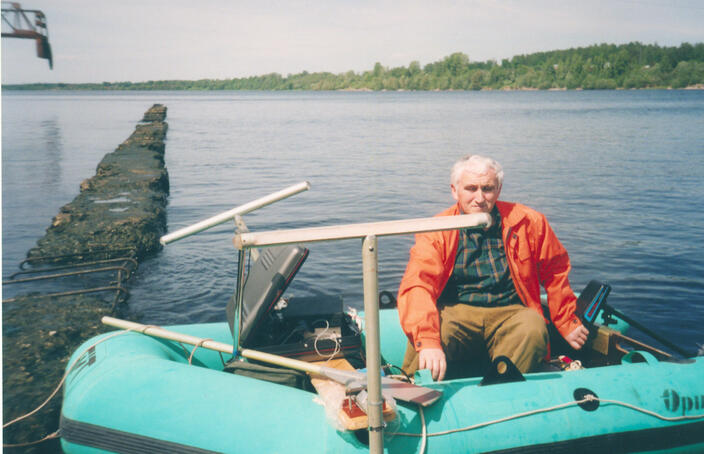
2001 г. IU "L-Konstante" (г.Рига) Мониторинговые геофизические исследования на участке ремонтно-профилактических работ в нижней части рисбермы водоотводного канала Кегумской ГЭС-2
2001. Mining Institute, Ural branch of RAS (Perm) Development and production a set of 64-channel mine seismic station IS-32/64.03
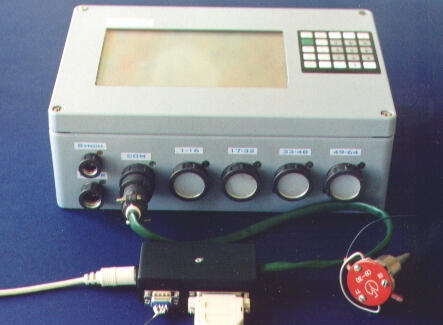
2001 г. Горный Институт УрО РАН (г.Пермь) Разработка и изготовление комплекта шахтной 64-х канальной сейсмостанции IS-32/64.03
2002 JSC Uralkali (Berezniki) Development and manufacturing a set of mine 64-channel seismic station IS-32/64.04
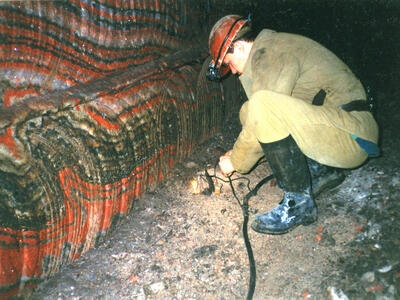
2002 г. ОАО "Уралкалий" (г.Березники) Разработка и изготовление комплекта шахтной 64-х канальной сейсмостанции IS-32/64.04
2002 SIA "Balt-Ost-Geo" (Riga) Geophysical surveys in the water area and coastal territory of avanport Ventspils (port section of AS " Ventbunkers")
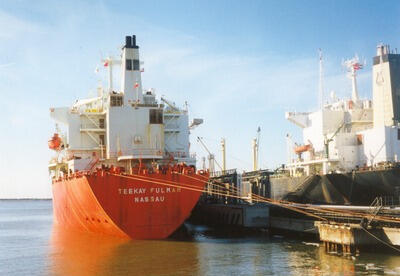
2002 г. SIA "Balt-Ost-Geo", (г.Рига) Геофизические исследования на акватории и прибрежной территории аванпорта Вентспилс (участок порта AS "Ventbunkers")
2002, Mining Institute Ural branch of RAS (Perm) Development and production of a set of blocks for 128-channel telemetric seismic engineering station IS-128.01
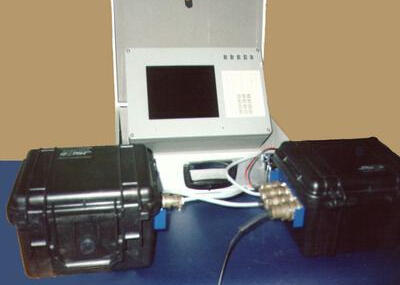
2002 г. Горный Институт УрО РАН (г.Пермь) Разработка и изготовление комплекта блоков 128-канальной телеметрической инженерной сейсмостанции IS-128.01
2003 SIA "Balt-Ost-Geo"(Riga) Seismic-acoustic profiling in the area of projected dredging works of Paldiski port (Estonia)
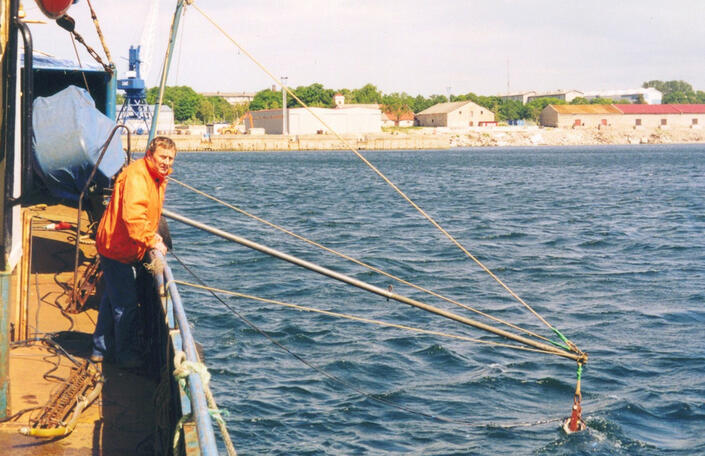
2003 г. SIA "Balt-Ost-Geo"(г.Рига) Сейсмоакустическое профилирование на участке проектируемых дноуглубительных работ порта Палдиски (Эстония)
2003 SIA "Meridians" (Daugavpils city, Latvia) Execution of works on seismic profiling in area 2 of the left-bank dam of Plavinas HPP
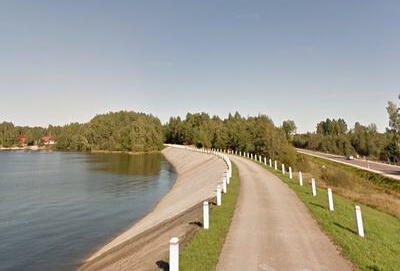
2003 г. SIA "Meridians" (г.Даугавпилс) Выполнение работ по сейсмическому профилированию на участке 2 левобережной дамбы Плявиньской ГЭС
2003-2004 SIA "Iženieri" (Riga, Latvia) Engineering-geophysical works for the study of the physical properties of the soil massif of the coastal slope of Ventspils port oil terminal by near-surface spatial seismic methods
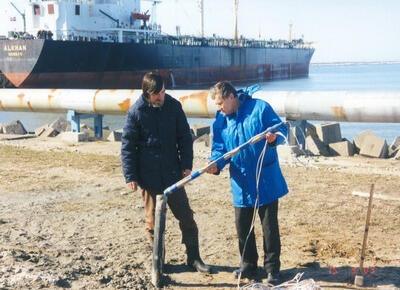
2003-2004 г. SIA "Iženieri" (г.Рига) Инженерно-геофизические работы по изучению физических свойств грунтового массива берегового склона Вентспилсской нефтегавани методами приповерхностной пространственной сейсмики
2004. Mining Institute, Ural branch of RAS, NPP "Intromag" (Perm) Development and production of a set of blocks 160-channel telemetric seismic engineering station IS-128.02
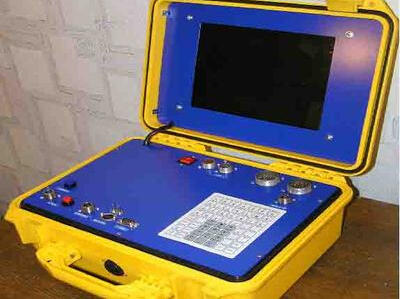
2004 г. Горный Институт УрО РАН, НПП "Интромаг" (г.Пермь) Разработка и изготовление комплекта блоков 160-канальной телеметрической инженерной сейсмостанции IS-128.02
2004 SIA "Meridians" (Daugavpils city, Latvia) Execution of works on seismic profiling at the site location of drainage wells in the downstream of Plavinas HPP
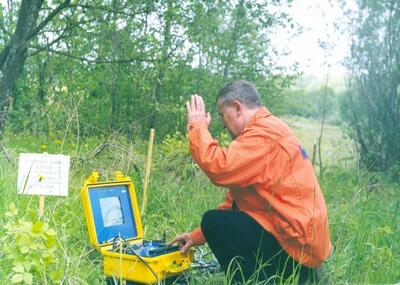
2004 г. SIA "Meridians" (г.Даугавпилс) Выполнение работ по сейсмическому профилированию на участке расположения дренажных скважин в нижнем бьефе Плявиньской ГЭС
2004 AS "Ceļuprojekts" (Riga, Latvia) Engineering-geophysical investigations at the site of right bank interchange of the South bridge over the Daugava river (Riga)
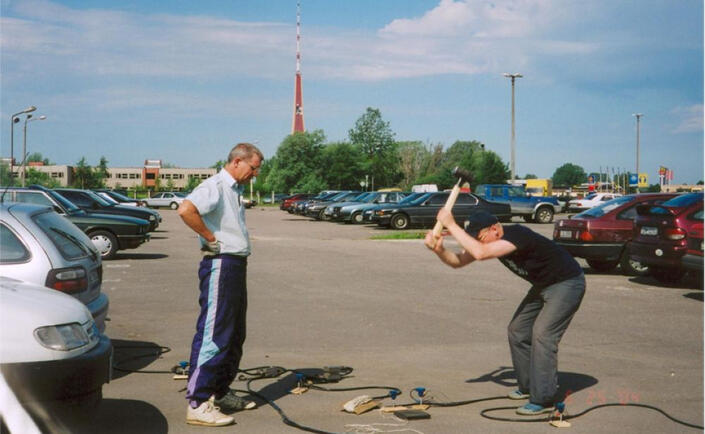
2004 г. AS "Ceļuprojekts" (г.Рига) Инженерно-геофизические исследования на участке правобережной транспортной развязки Южного моста через р.Даугава (г.Рига)
2005 SIA "Iženieri" (Riga) Monitoring geotechnical investigations to assess the state of soil massif of coastal slope of Ventspils port oil terminal after carrying out maintenance and repair works
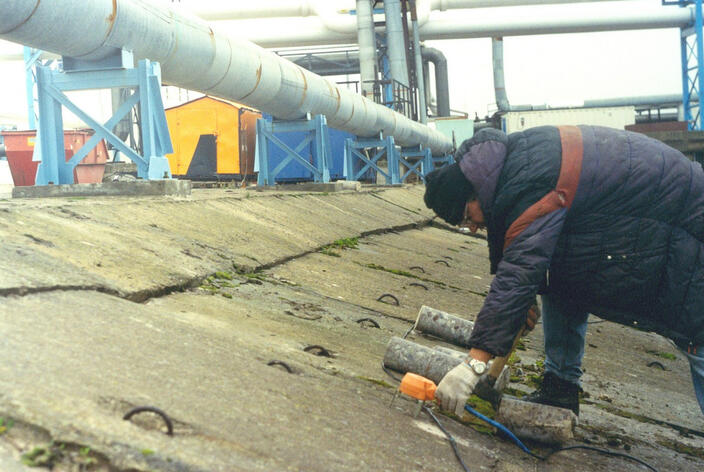
2005 г. SIA "Iženieri" (г.Рига) Мониторинговые инженерно-геофизические исследования по оценке состояния грунтового массива берегового склона Вентспилсской нефтегавани после проведения ремонтно-профилактических работ
2006 KU PP "Meridians" (Daugavpils), Kruono PSP (Kruonis) Seismoacoustic investigations in the area of water leak in deformation seam water intakes Kruonis pumped storage power plant (PSPP, Lithuania)
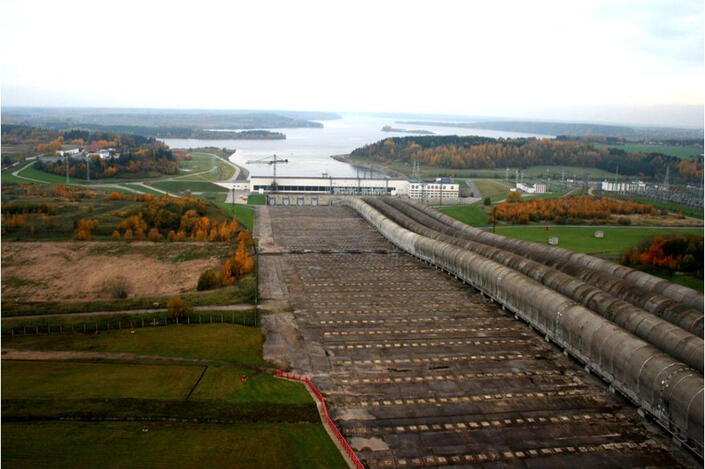
2006 г. KU PP "Meridians" (г.Даугавпилс), Круонисская ГАЭС (г.Круонис) Сейсмоакустические исследования в зоне протечки воды в деформационном шве водоприемника Круонисской гидроаккумуляционной электростанции (ГАЭС, Литва)
2006-2007 JSC "Morinzhgeologia" (Riga, Latvia) Development of software for data collection and processing of materials of trunk pipelines underwater crossing inspections through rivers and reservoirs
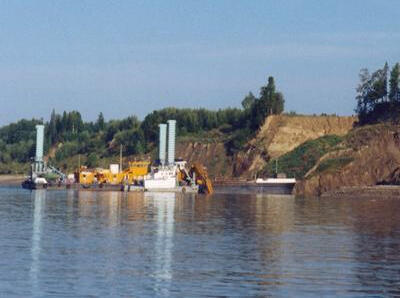
2006-2007 г.г. АО "Моринжгеология" (г.Рига) Разработка программного обеспечения сбора данных и обработки материалов приборного обследования подводных переходов магистральных газопроводов через реки и водохранилища
2008 GEOEXPLOR S. R. L (Peru) Acquisition of equipment, software development, works by method of refracted waves, the processing and interpretation of seismic data acquired on the dam sump flotation waste Choclon-2, (the province Marcona, department of Ica) and on four bridges of Shorey Road in Santiago de Chuco (Peru)
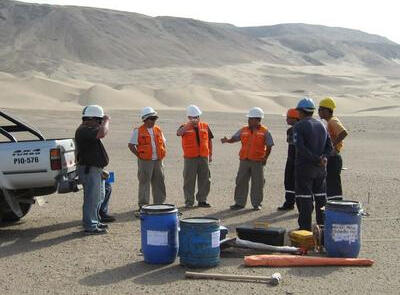
2008 г. GEOEXPLOR S.R.L (Перу) Комплектация аппаратуры, разработка программного обеспечения, выполнение работ методом рефрагированных волн, обработка и интерпретация сейсмических данных полученных на плотине отстойника флотационных отходов Choclon-2, провинция Marcona, департамент Ica и Santiago de Chuco (Перу)
2008 SIA "Meridians" (Daugavpils city), JSC "Hydroproject" (Moscow) Implementation of seismic surveys by methods of refracted and reflected waves (mini-CDP), electrical tomography and echosoundings on the site of the reserve spillway of Plavinas HPP
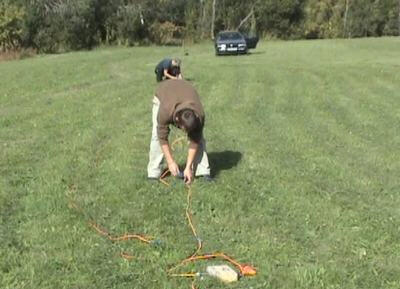
2008 г. SIA "Meridians" (г.Даугавпилс), ОАО "Гидропроект" (г.Москва) Выполнение сейсморазведочных работ методами рефрагированных и отраженных волн (мини-ОГТ), электротомографии и эхолотного промера на участке резервного водосброса Плявиньской ГЭС
2009 GEOEXPLOR S. R. L (Peru) Geophysical surveys using the methods of shallow-depth seismic surveys on the site of geotechnical investigations for the construction of high-rise dams on the Inambari river, departments Cuzco, Madre de Dios and Puno (Peru), processing and interpretation of data.
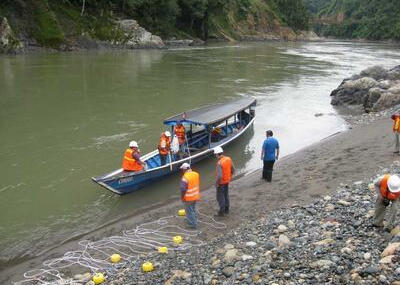
2009 г. GEOEXPLOR S.R.L (Перу) Геофизические исследования методами малоглубинной сейсморазведки на участке изысканий под строительство высотной плотины ГЭС на р.Инамбари, департаменты Cuzco, Madre de Dios и Puno (Перу), обработка и интерпретация данных.
2009 SIA "Balt-Ost-Geo", SIA "L-4" (Riga, Latvia) Performing of geophysical work on the properties of soil investigation at the construction site of the block CHP-2 (Riga)
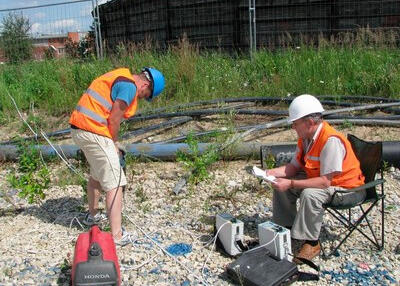
2009 г. SIA "Balt-Ost-Geo", SIA "L-4" (г.Рига) Выполнение геофизических работ по исследованию свойств грунтов на площадке строительства блока ТЭЦ-2 (г. Рига)
2009 SIA "Meridians" (Daugavpils city), JSC "Hydroproject" (Moscow) Performance of works by methods of shallow seismic survey and electro-tomography on the stilling basin of the reserve spillway area of Plavinas HPP
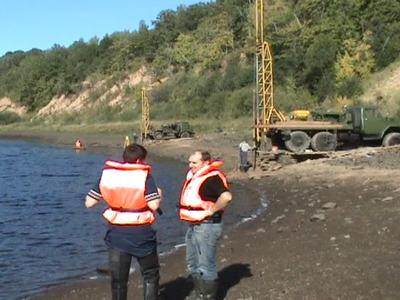
2009 г. SIA "Meridians" (г.Даугавпилс), ОАО "Гидропроект" (г.Москва) Выполнение работ методами малоглубинной сейсморазведки и электртомографии на водобойном участке резервного водосброса Плявиньской ГЭС
2009 GEOEXPLOR S. R. L (Peru) Seismic works by the method of refracted waves at the site of the proposed quarry Mazuko in the valley of the river Inambari, the Department of Madre de Dios (Peru).
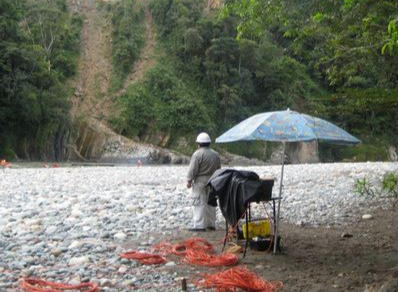
2009 г. GEOEXPLOR S.R.L (Перу) Сейсморазведочные работы методом рефрагированных волн на участке проектируемого карьера Mazuko в долине р. Инамбари, департамент Madre de Dios (Перу).
2010 GEOEXPLOR S. R. L (Peru) Processing of shallow-depth seismic data on the study of soil properties at the site of the projected hydropower station Carpapata, Junin Department (Peru)
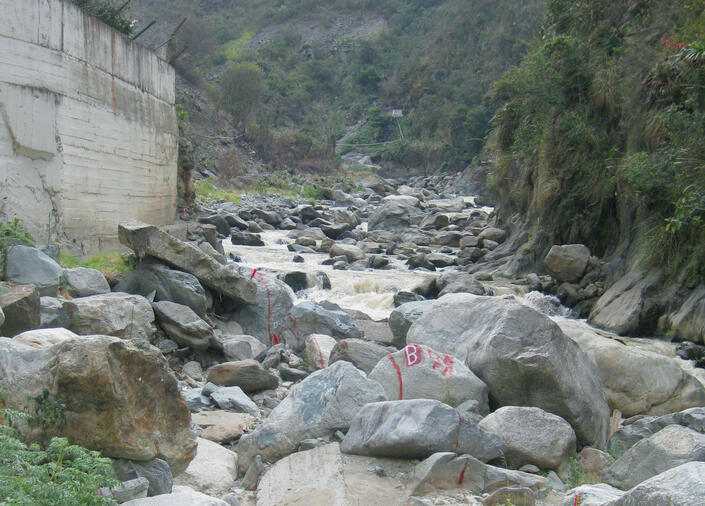
2010 г. GEOEXPLOR S.R.L (Перу) Обработка данных малоглубинной сейсморазведки по исследованию свойств грунтов на площадке проектируемой гидроэлектростанции Carpapata, департамент Junin (Перу)
2010 GEOEXPLOR S. R. L (Peru) Processing of shallow-depth seismic data on the study of soil properties at the site of the projected hydropower station Carpapata-2, Junin Department (Peru)
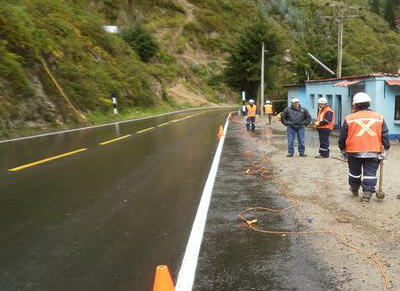
2010 г. GEOEXPLOR S.R.L (Перу) Обработка данных малоглубинной сейсморазведки по исследованию свойств грунтов на площадке проектируемой гидроэлектростанции Carpapata-2, департамент Junin (Перу)
2010 GEOEXPLOR S. R. L (Peru) Processing of shallow-depth seismic data on soil properties research at the site of Puente Nana bridge (Lima, Peru)
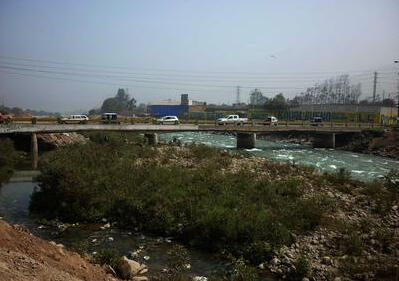
2010 г. GEOEXPLOR S.R.L (Перу) Обработка данных малоглубинной сейсморазведки по исследованию свойств грунтов на площадке моста Puente Nana (Лима, Перу)
2011 SIA "ATVV Aka" (Riga, Latvia) Testing work by the method of shallow seismic survey on the area of water intake in settlment Vangaži (Latvia)
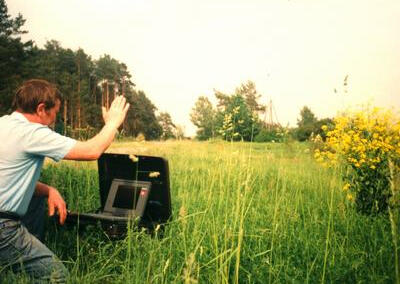
2011 г. SIA "ATVV Aka" (г.Рига) Опытные работы методом малоглубинной сейсморазведки на участке водозабора в п.Вангажи (Латвия)
2011 GEOEXPLOR S. R. L (Peru) MASW seismic data processing at the site of the high-altitude placer gold deposit Chucapaca-1, Moquegua Department (Peru)
2011 г. GEOEXPLOR S.R.L (Перу) Обработка данных сейсморазведки методом MASW на участке высокогорного месторождения россыпного золота Chucapaca-1, департамент Moquegua (Перу)
2011 GEOEXPLOR S. R. L (Peru) MASW seismic data processing on landslide site on the San Gaban area in the southern part of the highway Interoceanica , Department of Puno, Peru
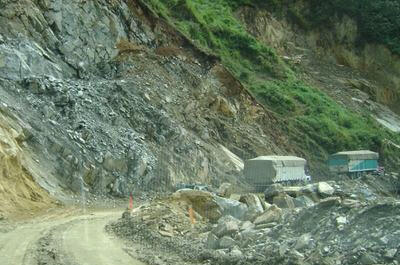
2011 г. GEOEXPLOR S.R.L (Перу) Обработка данных сейсморазведки методом MASW на оползневом участке San Gaban в южной части автотрассы Интерокеаника , департамент Puno, Перу
2012 GEOEXPLOR S. R. L (Peru) Processing of seismic data by methods of MASW and refracted waves at the site of the high-altitude placer gold deposit Chucapaca-2, Moquegua Department, (Peru)
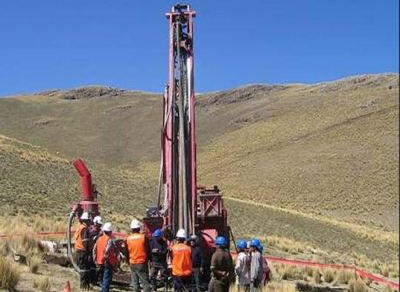
2012 г. GEOEXPLOR S.R.L (Перу) Обработка данных сейсморазведки методами MASW и рефрагированных волн на участке высокогорного месторождения россыпного золота Chucapaca-2, департамент Moquegua, (Перу)
2012 GEOEXPLOR S. R. L (Peru) Processing of seismic methods MASW and refraction of waves data at the site of irrigation facilities Chinecas, Department of Ancash, (Peru)
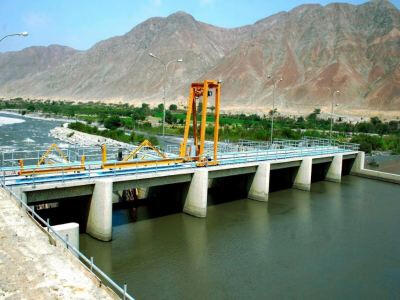
2012 г. GEOEXPLOR S.R.L (Перу) Обработка данных сейсморазведки методами MASW и рефрагированных волн на участке ирригационных сооружений Chinecas, департамент Ancash, (Перу)
2013 SIA " GTL "(Ventspils) Geophysical investigations of soil properties at the foundation of the passenger berth No. 18 of the free port of Ventspils
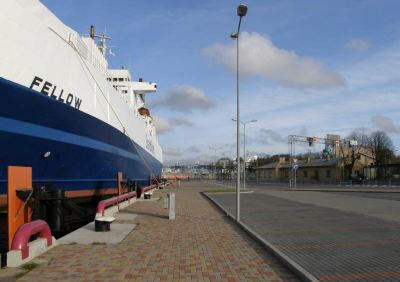
2013 г. SIA "GTL" (г.Вентспилс) Выполнение геофизических работ по исследованию свойств грунтов в основании пассажирского причала № 18 свободного порта Вентспилс
2013 GEOEXPLOR S. R. L (Peru) MASW seismic data and refracted waves technique data processing on the area of the Las Lomas bridge, Piura Department (Peru)
2013 г. GEOEXPLOR S.R.L (Перу) Обработка данных сейсморазведки методами MASW и рефрагированных волн на участке моста Las Lomas, департамент Piura, (Перу)
2013 Mining Institute of the Ural Branch RAS (Perm, Russia) Methodological support of seismic and acoustic investigations in boreholes, the development and adaptation of software for data processing of not longitudinal VSP
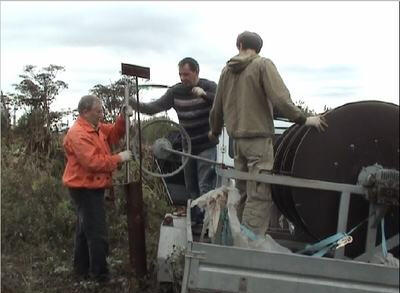
2013 г. Горный Институт УрО РАН (г.Пермь) Методическое сопровождение сейсмоакустических исследований в скважинах, разработка и адаптация программного обеспечения для обработки данных непродольного ВСП
2013 SIA " GTL "(Ventspils) Implementation of GPR studies of backfill soil array on the passenger berth № 23 of the Ventspils free port
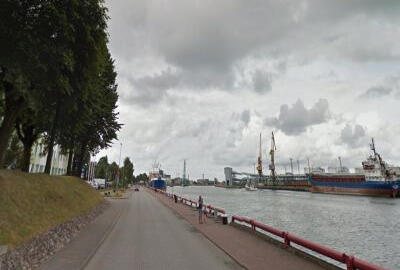
2013 г. SIA "GTL" (г.Вентспилс) Выполнение георадарных исследований грунтового массива обратной засыпки на пассажирском причале № 23 Вентспилсского свободного порта
2014 GEOEXPLOR S. R. L (Peru) MASW seismic method data and refraction of waves data processing at the site of construction Potrerillos, Department of Piura (Peru)
2014 г. GEOEXPLOR S.R.L (Перу) Обработка данных сейсморазведки методами MASW и рефрагированных волн на участке сооружений Potrerillos, департамент Piura (Перу)
2015 GEOEXPLOR S. R. L (Peru) MASW seismic method and refraction waves method data processing at the site of construction Ollachea, Department of Puno (Peru)
2015 г. GEOEXPLOR S.R.L (Перу) Обработка данных сейсморазведки методами MASW и рефрагированных волн на участке сооружений Ollachea, департамент Puno (Перу)
2015, AS "LNK Industries" (Riga) GPR investigation of the foundation soil of paved surface construction of the pier of Riga Bulk Terminal (Kundzinsala) of the free port of Riga
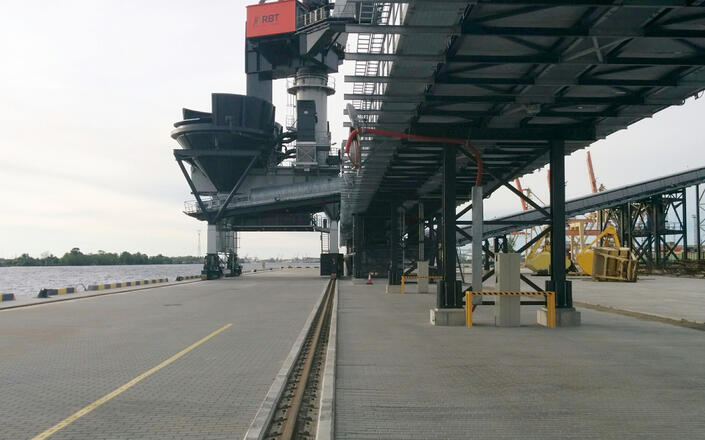
2015 г. AS "LNK Industries" (г.Рига) Георадарные исследования грунтового основания брусчатого покрытия причала Riga Bulk Terminal (Кундзиньсала) свободного порта Рига
2015 GEOEXPLOR S. R. L (Peru) MASW seismic data processing at the site of construction on the river Rio Blanco. Department Piura, (Peru)
2015 г. GEOEXPLOR S.R.L (Перу) Обработка данных сейсморазведки методом MASW на участке строителства на р. Рио Бланко, (департамент Piura,Перу)
2015 SIA " HT-Konsaltings "(Riga) Geophysical and engineering work on the study of the soil foundation of the berths JPS-1 and JPS-2 of the passenger terminal of the Riga port
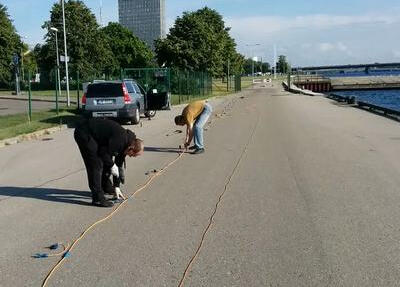
2015 г. SIA "HT-Konsaltings" (г.Рига) Инженерно-геофизические работы по исследованию грунтового основания причалов JPS-1 и JPS-2 пассажирского терминала Рижского порта
2016 Mining Institute Ural Branch of the RAS (Perm) Borehole seismic surveys in potentially hazardous areas of a mine field with subsequent digital processing
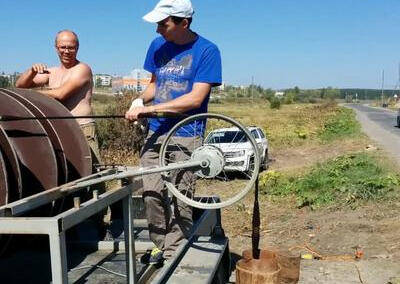
2016 г. Горный Институт УрО РАН (г.Пермь) Скважинные сейсмические исследования в потенциально опасных зонах шахтного поля с последующей цифровой обработкой материалов
2017 Mining Institute UB RAS (Perm) Execution of works on the mapping of fracture zones in oversalt strata in areas of accelerated earth’s surface subsidence with the use of a downhole seismic survey with subsequent digital processing and interpretation of data
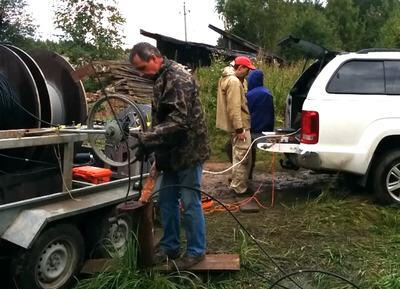
2017 г. Горный Институт УрО РАН (г.Пермь) Выполнение работ по картированию зон трещиноватости надсоляной толщи на участках ускоренных оседаний с применением скважинной сейсморазведки с последующей цифровой обработкой и интерпретацией материалов
2018 Mining Institute of the Ural Branch of the Russian Academy of Sciences (Perm), RUE “Belstroytsentr” (Belarus) Processing and interpretation of data on acoustic monitoring of freezing of rocks at the mine shaft sinking sites of the Nezhinsky Mining and Processing Plant
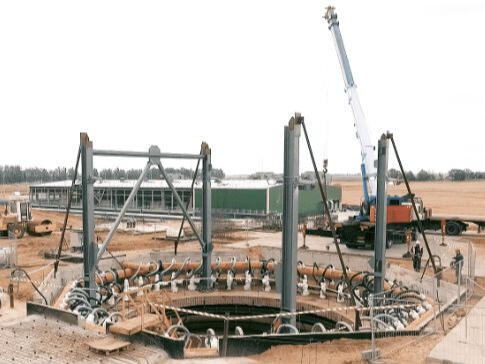
2018 г. Горный Институт УрО РАН (г.Пермь), РУП «Белстройцентр» (Белоруссия) Обработка и интерпретация данных акустического контроля замораживания горных пород на участках проходки шахтных стволов Нежинского ГОК
2018 Mining Institute of the Ural Branch of the Russian Academy of Sciences (Perm), PJSC "Uralkali" (Berezniki) Performing work on methodological support of vertical seismic profiling in the area of subsidence of the supra-salt strata of the Verkhne-Kama potassium salt deposit with subsequent digital processing and interpretation of materials.
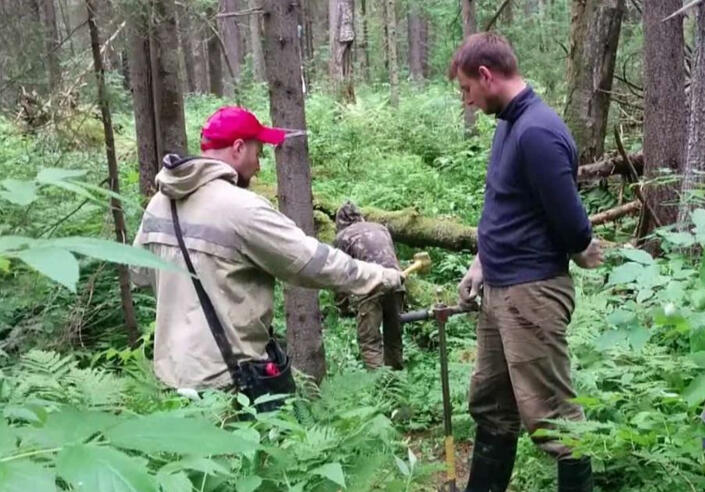
2018 г. Горный Институт УрО РАН (г.Пермь), ПАО «Уралкалий» (г.Березники) Выполнение работ по методическому сопровождению вертикального сейсмического профилирования на участке оседания надсолевой толщи Верхне-Камского месторождеия калийных солей с последующей цифровой обработкой и интерпретацией материалов.
2018 SIA “Firma L4” (Riga), Determination of electrical resistance of soils at separate points of the Spilve site.
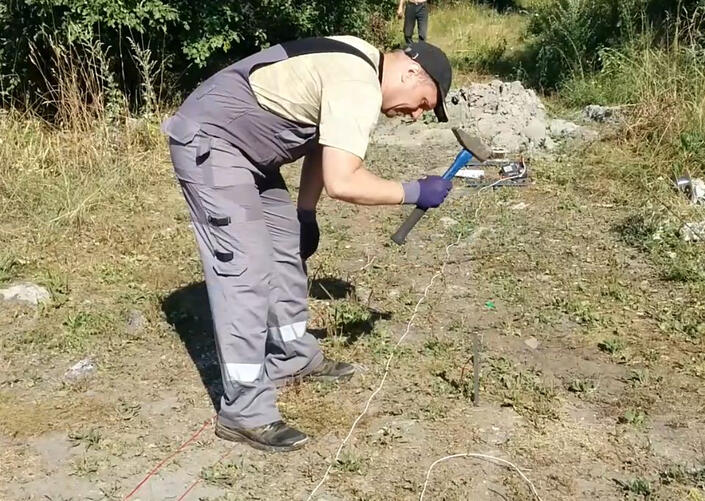
2018 г. SIA «Firma L4» (г.Рига), Определение электрического сопротивления грунтов в отдельных пунктах участка Спилве.
2019 Mining Institute of the Ural Branch of the Russian Academy of Sciences (Perm), PJSC "Uralkali" (Solikamsk) Methodological support for vertical borehole profiling in the zone of failure of the supra-salt strata and potential fracturing of the rock mass within the mine field of the SKRU-2 mine.
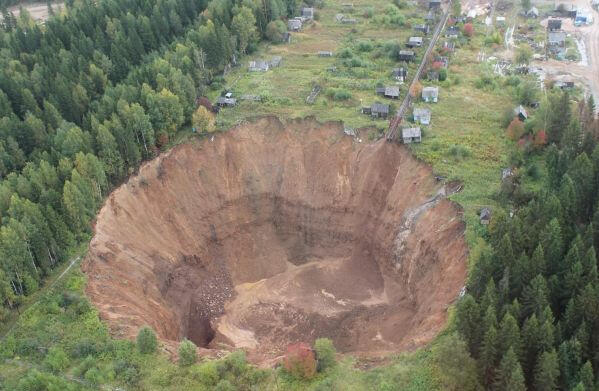
2019 г. Горный Институт УрО РАН (г.Пермь), ПАО «Уралкалий» (г.Соликамск) Методическое сопровождение вертикального скважинного профилирования в зоне провала надсолевой толщи и потенциальной трещиноватости породного массива в пределах шахтного поля рудника СКРУ-2.
2020 Mining Institute of the Ural Branch of the Russian Academy of Sciences (Perm), PJSC "Uralkali" (Solikamsk) Methodological support for vertical borehole profiling in the zone of potential fracturing of the rock mass within the mine field of the SKRU-2 mine.
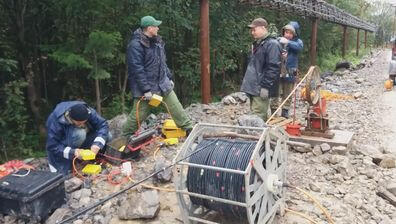
2020 г. Горный Институт УрО РАН (г.Пермь), ПАО «Уралкалий» (г.Соликамск) Методическое сопровождение вертикального скважинного профилирования в зоне потенциальной трещиноватости породного массива в пределах шахтного поля рудника СКРУ-2.
2021 SIA “Geoproject” (Riga) Georadar research from ice in the water area of the city pond “Dzirnavu” in Gulbene.
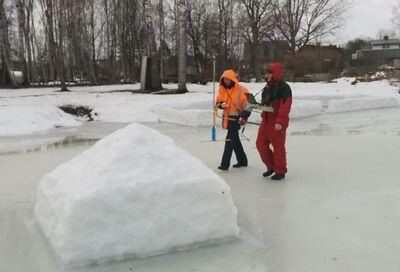
2021 г. SIA «Geoproject» (г.Рига) Георадарные исследования со льда на акватории городского пруда «Дзирнаву» в г.Гулбене.
2021 SIA “Inženieru birojs “Būve un Forma” (Riga) GPR scanning of the soil mass at the construction site of the athletics arena of the Daugava stadium
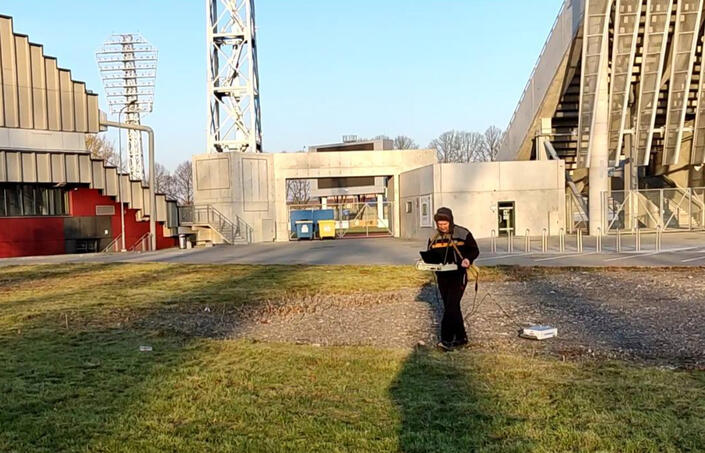
2021 г. SIA «Inženieru birojs «Būve un Forma» (г.Рига) Георадарное сканирование грунтового массива на участке строительства легкоатлетического манежа стадиона «Даугава
2021 Mining Institute of the Ural Branch of the Russian Academy of Sciences (Perm), PJSC "Uralkali" (Solikamsk) Methodological support for vertical borehole profiling in the zone of potential fracturing of the rock mass within the mine field of the SKRU-2 mine.
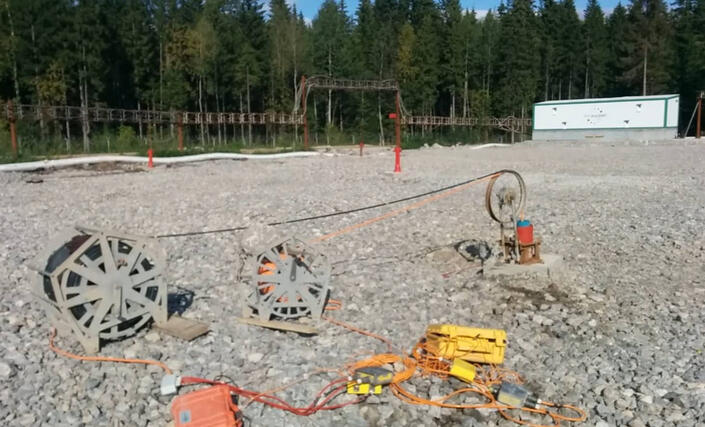
2021 г. Горный Институт УрО РАН (г.Пермь), ПАО «Уралкалий» (г.Соликамск) Методическое сопровождение вертикального скважинного профилирования в зоне потенциальной трещиноватости породного массива в пределах шахтного поля рудника СКРУ-2.
2021 Mining Institute of the Ural Branch of the Russian Academy of Sciences (Perm), PJSC "Uralkali" (Solikamsk) Methodological support for studies of the physical properties of the rock mass in a potentially dangerous section interval within the mine field of the SKRU-2 mine based on the study of man-made noise.
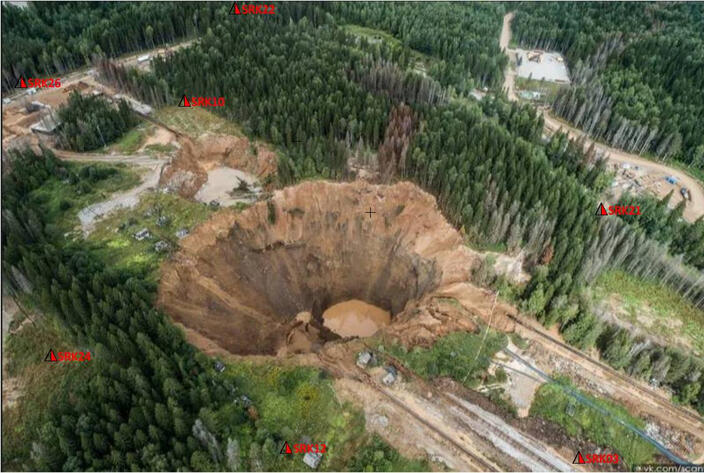
2021 г. Горный Институт УрО РАН (г.Пермь), ПАО «Уралкалий» (г.Соликамск) Методическое сопровождение иcследований физических свойств породного массива в потенциально опасном интервале разреза в пределах шахтного поля рудника СКРУ-2 на основе изучения техногенных шумов.
2023 SIA “Digitālās Ekonomikas Attistības Centrs” (Riga). GPR scanning of the soil mass at the construction site of the DEAC center.
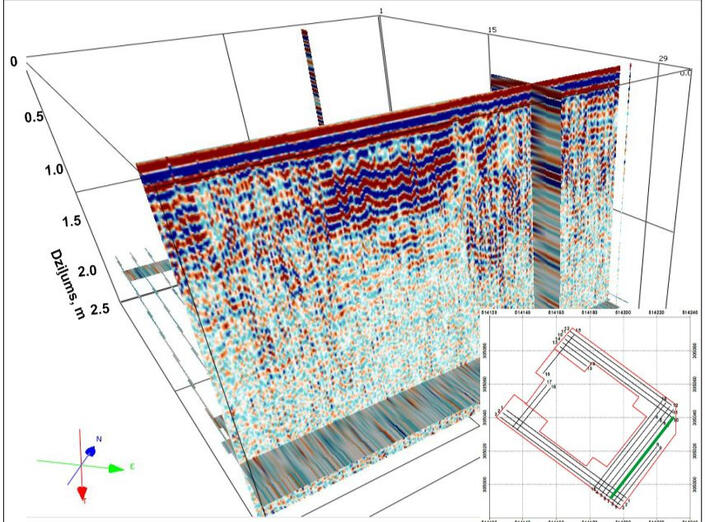
2023 г. SIA “Digitālās Ekonomikas Attistības Centrs” (г.Рига). Георадарное сканирование грунтового массива на участке строительства центра DEAC.
2023 SIA “I.A.R.” (Riga). GPR scanning of the soil massif at the site of reconstruction of the Olaine oil depot.
2023 г. SIA “I.A.R.” (г.Рига). Георадарное сканирование грунтового массива на участке реконструкции Олайнской нефтебазы.